
So you’ve been looking to make a career move to data analytics (also consider checking out this perfect parcel of information for a data science degree). You’ve probably taken up a course, done your homework. You’ve sought out firms for the position of data analyst. It took a while, but a firm has responded back, showing interest. They fix up an interview with you. You begin googling things to anticipate how the interview will go. And now, you’re on this page.
Top Data Analysis Interview Questions
Without further ado, let’s jump right into the questions, shall we?
Q1. What is the difference between statistics and machine learning?
You know there’s a difference. It’s almost obvious. You immediately begin to explain to the interviewer what you know. You’ve said too much and too little. You realize the interviewer wants a crisp answer and quick, and your fumbling doesn’t help.
For your answer, we take a look at the work of Bzdok et al in their nature methods research paper.
According to them, the difference is that “statistics draws population inference from a sample, machine learning finds generalizable predictive patterns.”
The inference is a process to test a hypothesis while prediction is a process to forecast future behavior. Statistics is focused on possible relationships between variables in the form of mathematical equations. However, machine learning consists of algorithms that can learn from data without relying on rule-based programming.
That said, statistical knowledge is an essential prerequisite for machine learning - it provides base and key steps to perform machine learning effectively.
Q2. What is the difference between analysis and analytics?
It is common to see these words being used interchangeably. There is however a world of difference. Analysis answers key questions during past events, while analytics forecasts the future based on analyzed data. We examine past events using analysis to identify if there was a decrease or increase in sales last summer or in any other specific month. Analytics is performed to predict future events and make educated guesses and extensions of trends, instead of explaining past events. Analytics can be seen as the application of computational and deduction techniques. For example, using past sales data we can discern customer’s behavior to come up with strategies to increase sales in the future.
Q3. What was your role as a data analyst in your previous position?
This is the most frequently asked question during an interview. So if you have prior experience, then cite accomplishments and skills along the lines of the following :
-
Designing and maintaining databases
-
Collecting Data and overcoming issues of redundant, incorrect or absent data
-
Data mining and data wrangling to make a more easily readable format of the data
-
Performing statistical analysis for data interpretation, specifically exploring possible trends or patterns using data visualization methods
-
Preparing reports to the colleagues and present it during meetings
-
Explaining the significance of findings and its effect in relevant field
-
Collaboration with computer programmers, engineers, researchers, and other organizational leaders to enhance business needs based on statistical inferences and forecasting
-
Implementation of new data analytics methods (also consider checking out this career guide for data science jobs)
These are the most common roles of a data analyst in any field. So prepare beforehand and show examples where you've performed the above functions. Your answers may have slight changes based on your previous experience as a data analyst. For example, in a research field, data analysts may also have to show contributions in writing research papers and present relevant findings in seminars. For those without prior experience, citing project work and some of the above functions will give a very good impression to the interviewer.


Q4. What is the difference between supervised and unsupervised learning?
Supervised and unsupervised machine learning are two key concepts of data science. It is imperative that you understand and explain clearly to the interviewer these terminologies when asked. The majority of tools used by data scientists to predict future outcomes rely on supervised machine learning techniques.
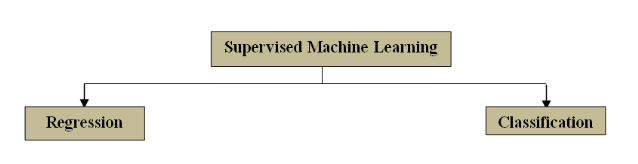
Methods used in supervised learning require prior supervision to train the model. Model training is done by using labeled data with the known outcome (known values of dependent variables). The trained model is later utilized to predict the dependent value of new data given new independent values. Two major methods used in supervised learning are classification and regression.
You may also like: Linear Regression With Python scikit Learn
Classification alludes to categorizing data into sets that have their specific traits and regression essentially involves coming up with function values beyond the range of the data already available.
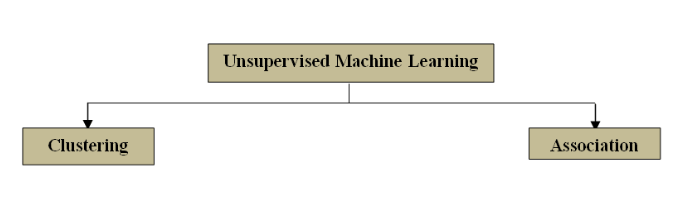
On the other hand, unsupervised machine learning does not require any prior training of the model. There is no prior knowledge of the output values of our data set. The main goal of unsupervised learning is to find the hidden structure in data. Algorithms used in unsupervised machine learning are used to draw inferences from data without labeled response (Here's the perfect parcel of information to learn data science). Two major examples of unsupervised machine learning are clustering and association. As the names suggest, clustering algorithms are aimed at unearthing groups within the data set and association is aimed at discovering relationships within the data points.
Q5. How do you deal with missing data?
Missing data is ubiquitous in virtually any raw data set and is a peril that plagues any data scientist. Missing data can easily skew the conclusions of any analysis performed. That said, however, certain data holes are better than others. Data missing completely at random (MCAR) and data missing at random (MAR) do not increase too much bias in the study. However, data missing not at random (MNAR) is a major issue.
Few techniques have been suggested to handle missing data, either random or non-random:
-
Plan your study and data collection carefully
-
Form of manual of operations at the beginning of the study
-
Provide training to all personals who might be associated with data
-
Document the missing data especially in case of eliminating it
-
Use data analysis methods to handle missing data
-
Adopt common approaches like listwise, pairwise or case-wise deletion
-
Mean substitution
-
Imputation
A detailed explanation of these methodologies can be found here. Note that certain methods mentioned above may depend on the field of study or the case, so answer accordingly if an example is given.
Q6. What tools have you used before the purpose of data analysis?
The tools a data analyst needs to familiar might be very domain and project-centric, but here are a handful of general tools data analyst use:
-
A programming language, such as Python, R, SAS, Apache Spark, SAS, Tableau public, Stata, etc
-
Being able to work with relational databases, such as MySQL, SQL server, etc.
- Reverse ETL tools to send data to business applications
- Extracting, transforming and loading data, such as CloverETL, Talend, RapidMiner, Beautiful Soup
-
Hadoop
-
Tools related to data visualization such as matplotlib and seaborn in Python, and ggplot2 in R
-
Libraries associated with statistical analysis and machine learning such as sklearn in python
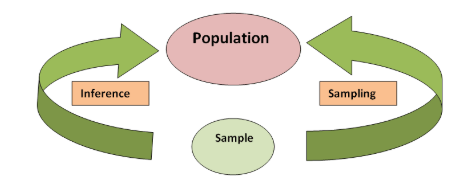
Q7. What is the difference between a sample and the population?
It is important to know if the data we are dealing with is a population or a sample. A population is the collection of all items of interest in our study. It is denoted as N. A sample is a subset of the population and denoted as n. We gather information about the population through statistical methods or inferential means.
Q8. What is the difference between classification and regression?
Classification and regression are types of supervised machine learning. Both regression and classification use training data set to predict the outcome on the test or new datasets. The goal of classification is to predict the category of a new observation. However, in regression, we aim to estimate or predict response or quantity.
Q9. What is imputation and what are the different types of imputation?
Imputation is a statistical process to replace missing data with values. In this process, we do not remove any variable or observations with a missing value.
There are many imputation methods utilized in data analysis. Some examples are mentioned below:
-
Mean imputation
-
Substitution
-
Cold deck imputation
-
Hot deck imputation
-
Nearest neighbor
-
Regression imputation
-
Multiple imputations
-
Single imputation methods like last observation carried forward (LOCF) and baseline observation carried forward
-
Maximum likelihood such as expectation-maximization
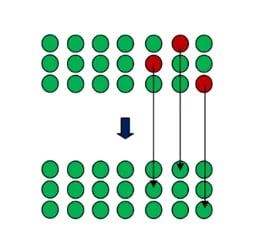
Q10. What is the KNN imputation method?
K-nearest neighbor (KNN) is a classification approach to supervised machine learning. Nearest neighbor (NN) approaches are donor-based methods. KNN is a type of NN approach and uses average of measured values of the neighbors, or weighted mean (distance to neighbors are used as weights). Concepts of NN approaches are elucidated here.
You may also like: 10 Machine Learning models to know for beginners
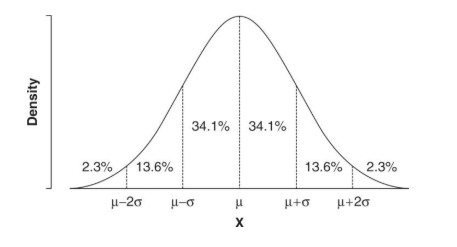
Q11. What do you mean by normal distribution?
Normal distribution is the most common continuous probability distribution. It is also known as the bell-shaped curve or the Gaussian distribution. Normal distribution most commonly suggests that most data occurs near the mean and dwindles down the farther you go. In case of the normal distribution, mean we expect certain observations:
-
Mean is 0 and the standard deviation is 1
-
Skewness is 0
-
Kurtosis is 3
Q12. Why do we use non-parametric methods? What are some examples?
Nonparametric approaches do not rely on the specific form of the data or its sizes (n) - such as the particular parametric family or the probability distribution. Non-parametric techniques use lesser assumptions about the nature of the underlying distribution.This is why they are also known as distribution-free methods. It is most commonly used when there is an unknown distribution in population data or when sample size is small (n < 30). The most common statistical techniques are mentioned below:
-
Anderson-darling test
-
Kaplan-Meier
-
Kendall’s tau
-
Kolmogorov-Smirnov test
-
Kruskal Wallis
-
Log-rank test
-
Mann-Whitney U or Wilcoxon rank-sum test
-
McNemar’s test
-
Sign test
-
Spearman’s rank correlation test
-
Wilcoxon signed-rank test
Q13. What is the difference between data profiling and data mining?
Data mining is the collective use of quantitative methods (clustering, classifications, neural networks, etc) to extract knowledge in the form of patterns, correlations, or anomalies from large amounts of data. The results obtained are used to predict outcomes.
David Loshin explained data profiling as a process of analyzing raw data for the purpose of characterizing the information embedded within a dataset. Different statistical and analytical algorithm of data profiling helps to gain insight into the content of the dataset and qualitative characteristics of those values.
Q14. What is the Kmeans algorithm?
Kmeans is an unsupervised clustering approach. Like other clustering approaches, Kmeans is also used as an exploratory data analysis to figure-out any possible inference or any hidden structure in the data. It uses a predefined number (K) of non-overlapping clusters. Data points in the Kmeans algorithm are homogenous within clusters. However, it keeps the number of clusters as far as possible. Steps for Kmeans are mentioned below:
-
Choose the number K of clusters
-
Select at random k points, the centroids
-
Assign each data point to the closest centroid
-
Compute and place the new centroids of each cluster
-
Reassign each data point to the new closest centroids, until reassignment is over.
Q15. What is logistic regression?
In many instances when performing logistic regression, the response of interest (Y) or outcome variable is dichotomous/binary rather than continuous. The model uses a binary response variable as the outcome is known as the logit model or logistic regression.
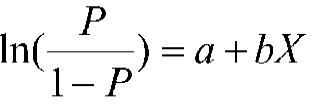
This logistic function, rather than following a straight line, follows a sigmoid curve.
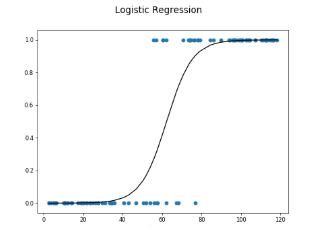
We use logistic regression analysis as a regression approach for inferences. Nevertheless, in machine learning, it falls under the classification approach.
Q16. What does data cleansing mean?
Data cleansing or data cleaning is an exhausting, and yet, very necessary step in data analysis. The initial raw data is far from ideal in most cases. It may have incorrect, incomplete, or duplicated data. There is a possibility of spelling errors, changes in the unit of data, creating new columns based on previous columns.
Data cleaning does not imply eliminating data. Rather it is a process to enhance the quality of data. If you input garbage in a model, your output or final results will also be garbage. Hence, data cleansing a pivotal step in data science.
Q17. What is data validation and what methods are used in data analysis for performing data validation?
The examination of accuracy and quality of data prior to analysis is called data validation. In other words, we can say it is a form of data cleansing. Here is a list of methods used for data validation:
-
Source system loopback verification
-
Ongoing source to source verification
-
Data-issue tracking
-
Data certification
-
Statistics collection
-
Workflow management
Q18. Name some common problems you faced as a data analyst?
There are few problems a data analyst may have to face. Most of these problems are associated with the data cleansing issue. Some of these examples are mentioned below.
-
Missing values
-
Wrong values
-
Duplicate data
-
Spelling errors
-
No proper information or record of variables
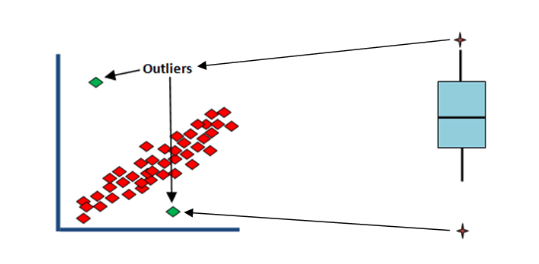
Q19. What is an outlier?
In statistics, outliers are data points that do not follow the common behavior like the majority of other data points. Outliers significantly differ from other data points. The inclusion of outliers distorts the real associations, hence false interpretation or prediction. They are a well known potential threat. They either occur by chance or through measurement error. Outliers are most commonly detected by the box plot method or standard deviation method (± 3SD). Here is an illustration.
Q20. What are statistical/ML methods have you worked most commonly with?
The answer to this particular question depends on your work in previous positions. Your answer may generate more relevant questions associated with answered statistical methods. The most common statistical methods used by a data analyst are:
-
T-test
-
ANOVA
-
Correlation
-
Chi-squared
-
Regression analysis
-
Simple linear regression
-
Multiple linear regression
-
Polynomial regression
-
Support vector regression
-
Decision tree regression
-
Random forest regression
-
Ridge regression
-
Lasso regression
-
Classification analysis
-
Logistic regression
-
K-nearest neighbors
-
Support Vector Mechanisms
-
Kernel SVM
-
Naïve Bayes
-
Decision Tree Classification
-
Random Forest Classification
-
Cluster analysis
-
K-Means clustering
-
Hierarchical clustering
-
Re-sampling methods
-
Natural Language Processing
-
Deep learning
-
Artificial neural network
-
Convolutional neural network
-
Reinforcement learning
-
Upper Confidence bound
-
Thompson sampling
-
Dimensionality reductions
-
Principal Component Analysis
-
Kernel PCA
-
Linear Discriminant Analysis
All of these above-mentioned techniques are essential to learning for a data analyst. There is a huge possibility of many questions from these statistical or machine learning methodologies.
Conclusion
These questions are not exhaustive. For example, I haven't included questions about specific tools. The goal was to address the domain level questions that interviewers ask. Outside of these questions, here are a few key tips to help you :
- If you don't understand the interviewer's question clearly, ask him or her to rephrase the question politely.
- Explain your thought process with which you arrived at the answer.
- Do not lose composure if you don't know the answer to a question. Be honest and say that you do not know the answer.
- Speak clearly, and at a moderate pace. If you speak too fast, you'll come off as anxious and the interviewer may not catch all the points you've made.
If you're having an online interview, then take a look at this article for interview tips over video conferencing.
Want a Data Science job? Join OdinSchool's online Data Science Bootcamp now!