
Business decisions of today rely on the latest trends in the market. The advances in technology have led to rapid growth. This, in turn, has led to companies generating data on a large scale. Data analysts process this data to get insightful reports. If you are a big data professional or data scientist, you will be working with large datasets on a daily basis.
Numeric calculations, graphs, formulas are used to create a structured format from raw data. Employers are willing to pay analysts with expertise in querying and programming. Languages like SQL, Java, Python, R are in high demand for working with these analytic tools.
We present nine of the most effective data analysis tools used by the analysts at the workplace.
KNIME
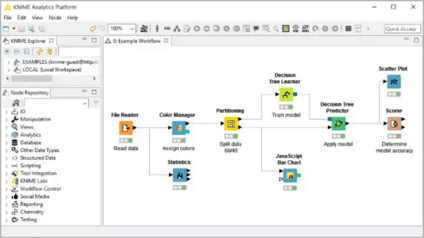
Source: knime.org
Developed at the University of Konstanz, KNIME is an open source data analytics tool. It stands for Konstanz Information Miner. It allows users to create data flows or pipelines and then use select analysis steps.
It has an extension mechanism that allows it to integrate data in different formats (also consider checking out this perfect parcel of information for data science degree). Analysts create reports by working on .csv, .pdf, .ppt, .doc file formats.
The KNIME tool performs the ETL(Extraction, Transformation, Loading) method of data processing. This is possible due to the use of nodes using a GUI. It finds application in the areas of machine learning and data mining.
OpenRefine
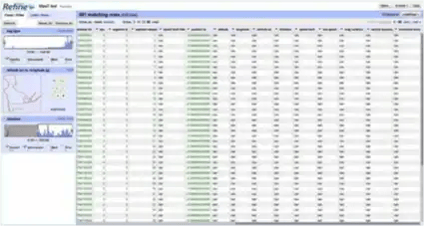
Source: LWN.net
This is an open source desktop application for visualizing data. It can transform data to other formats which are known as data wrangling. The tool operates on rows of data which resemble database tables.
Each row can be filtered to process data and display the information. The formulas for transforming the data is not stored in the cells. The unique thing about OpenRefine is data gets transformed only once.
The tool has a web user interface and code can be written in Java, Python, Clojure, and GREL. It also allows import and export of data in many formats such as .csv,.html, excel,json. Data can be cleaned and transformed as per the needs.
RapidMiner
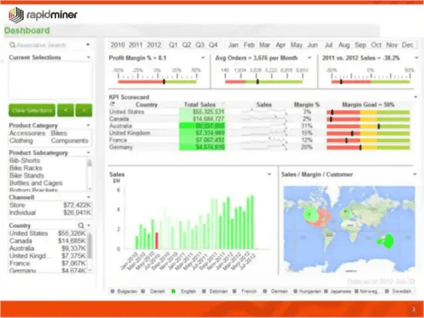
Source: slideshare.net
One of the best examples for SaaS, Rapidminer is a popular choice among data analysts. The platform is provided as a service, so there is no need for writing any code. This platform is able to take any kind of data and transform it to give customized results.
As a data analyst, you can manipulate, analyze and visualize data with the help of the features of this tool (also consider checking out this career guide for data science jobs). The template-based model allows it to create some of the best data reports for companies.
This award-winning tool finds application in the following areas:
- Statistical analysis
- Predictive analytics
- Data mining
- Machine learning
Orange
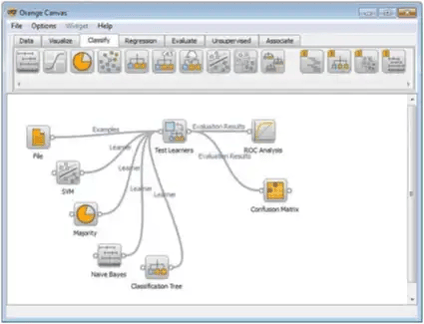
Source: wikis.evergreen.edu
Orange is an open source software package for data analysis and visualization. It has a component-based visual programming front-end for data processing. The components are known as widgets which can be pre-defined or customized.
The widgets are linked to the workflows with the help of an interface. The GUI enables programming for data manipulation. If you are an advanced user, you can alter the widgets and use the tool as a Python library.
Analysts can use the Orange tool for simple data visualization, pre-processing and empirical studies. It finds application in the areas of machine learning and data mining.
Google Fusion Tables
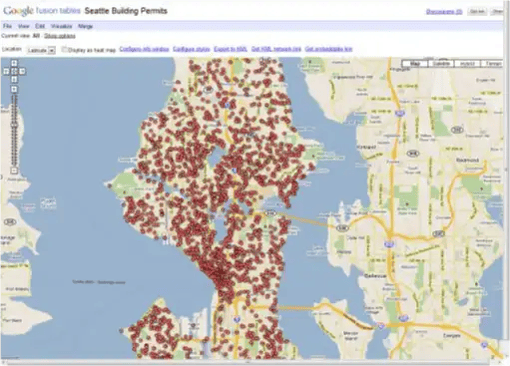
Source: coreymurata.wordpress.com
This web service helps to visualize data with the help of select features. Data study includes using line plots, scatterplots, bar charts, pie charts, and geographical maps.
You can filter data and make changes to hundreds of data rows as per the needs. It also allows you to merge tables with varying content. The custom data can be added to field data to present a structured report. It helps in creating high-quality data visualizations.
Tableau Public
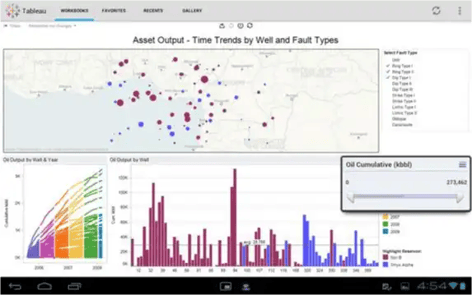
Source: quora.com
This is an interactive business tool that presents data in different visual formats. It allows you to create attractive dashboards, charts, and graphs to study data. It helps to build useful reports to gain insights.
Analysts prefer Tableau as it allows them to explore data in many formats. It has a mapping functionality and is able to plot geographic coordinates. This tool can query relational databases, cloud databases, and spreadsheets to generate data reports.
Gephi
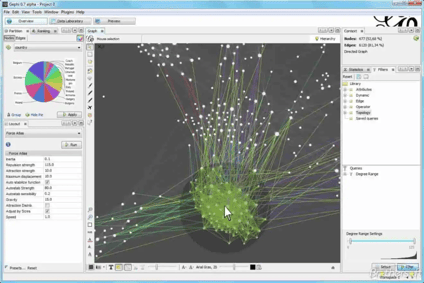
Source: brothersoft.com
This is an open source software developed in France and written in Java. It is used to explore various kinds of data and create data visualization reports.
The tool helps you present complex graph data as a map and create reports. The data visualizations are customized as per the needs. The tool has a simple layout for reading and can highlight important nodes with colors and shapes.
The Gephi tool finds application in the areas of network analysis and link analysis. It helps to understand and map data for small networks and community groups.
Weka
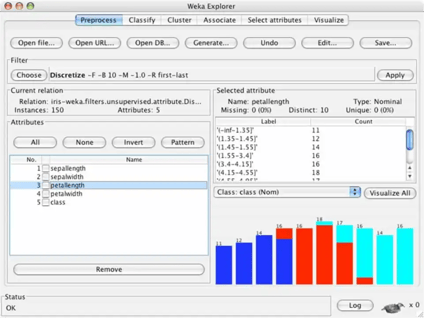
Source: predictiveanalyticstoday.com
This is a software suite that contains a collection of data visualization tools. It is written in Java and developed for effective data modeling methods. The GUI enables easy access to perform the tasks in a simple way.
The tool converts a collection of linked database tables into a single table. This makes data processing easier and leads to improved reports. The tools use special algorithms designed for data analysis and predictive modeling.
The Weka tool provides support for essential data mining tasks. The tool functionality is used for the following stages:
- Data preprocessing
- Clustering
- Classification
- Regression
- Visualization
- Feature selection
Zoho Reports
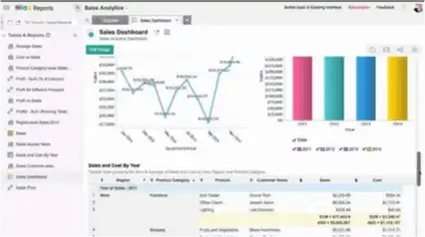
Source: predictiveanalyticstoday.com
This is an important tool for data visualization and helps analysts create effective reports. You can synchronize data from web applications and spreadsheets to create reports. Analysts convert data into charts, tables, graphs, and pivots to include them in business reports.
You can upload data from spreadsheets in .csv, Excel, and HTML formats. One can push large data from web apps and databases for analysis. Using the drag-and-drop interface, you can analyze data and build insightful reports.
The reports and dashboards can be embedded in web applications. This enables a number of contributions from colleagues and encourages data sharing. SQL queries add to the flexibility of reports, and the data is protected with secure encryption.
Most of these tools are free, open source, and simple to use. If you are unaware of the features of the tool, you can learn about it on the internet. These tools help analysts save time, create great reports and improve business results.
Want to master the most in-demand tools and technologies in Data Science? Explore our hands-on Data Science Course!