
Hypothesis testing is a statistical technique that tells us whether the tests of our experiment have shown any meaningful results. After hypothesis testing, you can tell whether the test results have happened due to pure chance or a significant intervention. If it is down to chances, it will be difficult or impossible to replicate the results. However, if it is due to a particular instance, knowledge of that will enable us to replicate the results time and again.
Hypothesis Testing and Steps Involved in It
A null hypothesis (Ho) assumes there is no relationship or statistically significant difference between two groups or phenomena that are under consideration. The alternative hypothesis (Ha) is the reverse of a null hypothesis, which means that it assumes there is a relationship between the selected variables in a statistical study.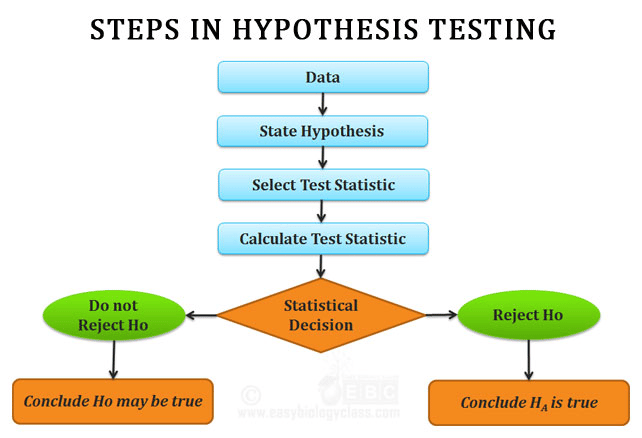
Source: Medium
In hypothesis testing steps, the person conducting the test states these two hypotheses. Since both are opposites, only one of the two hypotheses can be correct. The alpha and beta risks are also identified as a part of this statistical data analysis. Alpha risk is the risk of incorrectly rejecting the null hypothesis. Beta risk, on the other hand, is the risk of not rejecting an incorrect null hypothesis.
The next step is to formulate the plan to evaluate the available data to arrive at the correct hypothesis. The tester carries out the plan and analyzes the sample. The tester then summarizes the result from the data analysis tools to find out which of the two hypotheses stands. Based on the data, the tester may reject the null hypothesis or the testing may fail to reject it. This, in short, answers what hypothesis testing is.
Why Is Hypothesis Testing Needed in Six Sigma?
Using statistical techniques and formulae is a part of a Six Sigma manager’s work profile. In a Six Sigma project, the manager makes key decisions based on statistical test inferences. Hypothesis testing allows a greater degree of confidence in these decisions because they are not merely the mathematical differences between two samples.
Let us assume that a Six Sigma project produces thermal power. The quality of coal used as a raw material may influence the wattage of power generated. As the Six Sigma project manager, you want to establish whether there is a statistically significant relationship between the coal grade used and the power generated. With hypothesis testing, you can frame the proper null hypothesis, identify the alpha risk and the beta risk, and calculate the test statistic or p-value. This will help you to arrive at a more informed conclusion on your coal quality and power generation theory.


Benefits of Using Hypothesis Testing in Six Sigma
While working on a process improvement activity in a Six Sigma project, hypothesis testing helps you decide or identify a particular result or difference. If you want to find out whether the changes in your process are due to your process improvement measures or happened by chance, hypothesis testing statistics are the information to use.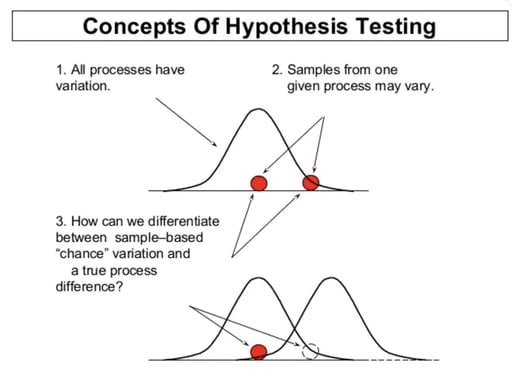
Source: SlideShare
Hypothesis testing is useful in measuring the progress of your project as you strive to improve your product or service. Since it’s a test of significance, hypothesis testing helps you prove whether the data is statistically significant. In terms of Six Sigma hypothesis testing examples, it could be decisive in spotting the improvements in your product or service or the lack of them.
In a decision made based on a sample study, there is a probability that non-representative samples may flaw the decision. However, a hypothesis test converts a practical problem into a statistical problem, consequently giving us an estimate of the probability of a non-representative sample.
A process may face problems with centering or problems with spread. In other words, the mean of two processes may be different, or the variances of the two processes may be different. Both are instances of differences in distribution. Hypothesis testing can help us analyze whether the difference between the two data sets is statistically significant.
9 Types of Hypothesis Testing for Six Sigma Data Analysis
1) Normality – Normality tests whether the sample distributes normally. Here the null hypothesis states that the population is normally distributed, while the alternative hypothesis states otherwise. If the p-value of the test is less than the defined significance level, the tester can reject the null hypothesis.
The sample size is crucial in normality testing. If the sample size is large, a small deviation can project a statistically significant p-value, which will be difficult to detect in case of a small sample size. A Six Sigma project manager would consider the sample size before relying on the normality test result.
2) T-test – A T-test compares the respective means of two data groups. In a project, it is useful to find out whether two data sets are different from one another or whether a process or treatment has an effect on the population. In a T-test, the data has to be independent and normally distributed to an aggregable degree. The data groups should have a similar amount of variance. These assumptions are part of the T-test as it is a parametric test of difference. T-tests will make the pairwise comparison only, and other types of hypothesis testing are for more than two groups.
3) Chi-Square Test for Independence – Let us assume that we have two categorical or nominal variables, and we are assuming that the two variables are unrelated. The Chi-Square test of independence tests whether the two are related or not. In a Six Sigma project, the project team has a choice of two different software apps to use in the development phase. They cater to American and European markets. The team assumes that neither market has any specific preference when it comes to the two software apps. The Chi-Square test of independence finds out whether our null hypothesis that software and the client’s geographical origin are unrelated can be rejected or not. 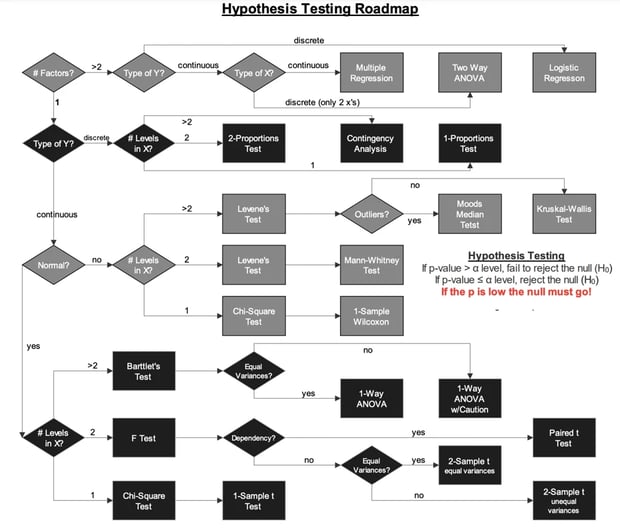
Source: Deployopex
4) Homogeneity of Variance (HOV) – HOV tests the homogeneity of variances between populations. With an assumption that variances among different groups are equal, you can pool such groups together to estimate the population variance. With HOV you get a better assurance of this variance homogeneity, which can encourage you to use smaller sample sizes or make better interpretations from the same sample size.
In the case of two groups, you can assume that the variance would be one (the null hypothesis). Anything other than a variance of one, i.e., equal, would be in support of the alternative hypothesis. In the case of three or more populations, the alternative hypothesis would be that one population variance is different.
5) Analysis of Variance (ANOVA) – ANOVA compares the means of different groups to test if they significantly vary from one another. For instance, in a project, ANOVA can check whether there are multiple approaches to solving a particular problem. The mean, in this case, time taken to solve the problem, of all these approaches will help us find out the effectiveness of each approach. If there are only two groups, T-test and ANOVA will show the same result. The null hypothesis in ANOVA is that no sample means have any significant difference. Any difference in even one sample means would mean rejection of the null hypothesis.
6) Mood’s Median – Mood’s Median tests the similarity of medians across two or more populations. It is a non-parametric test, which means that it doesn’t make any assumption based on normally distributed data, unlike ANOVA, for instance. Non-parametric tests are a better failsafe against wrong inferences. Nevertheless, it has a null hypothesis as it should, which is that there are no significant differences between the medians under consideration.
7) Welch’s T-test – Also known as Welch’s Test for Unequal Variances, it checks two sample means for significant differences. The null hypothesis is that the means are equal while the alternative hypothesis is that the means are not equal. In Welch’s test, there is a modification in the degrees of freedom over the student’s T-test. Unlike the T-test, it doesn’t assume equal variances. It is more reliable when both the groups have unequal sample sizes and variances. But statisticians don’t recommend Welch’s T-test for small sample sizes.
8) Kruskal-Wallis H Test – Like Mood’s Median, Kruskal-Wallis H Test is a non-parametric variation of ANOVA. The two hypotheses in it are that the population medians are or are not equal. To run this test, the tester uses ranks of the data value, rather than the data values themselves. While Kruskal-Wallis will find out the significant differences between the populations, it doesn’t tell you which groups are, in fact, different. This test assumes there is one independent variable with two or more levels. The observations should be independent, with no relation among data points in different groups. Besides, all the tested groups must have s\distributions of similar shape.
9) Box-Cox Power Transformation – Box-Cox Power Transformation allows a broader test diameter, with normality not being a required assumption. It is known as power transformation because it transforms non-normal dependent variables into a normal shape. Box-Cox Power transformation uses an exponent called lambda. Its test value can vary from -5 to 5. Of all the test values of the lambda, the one that’s optimal value has the best approximation of a normal distribution curve.
How To Choose a Hypothesis Test for Six Sigma Data Analysis
As can be seen in the different types of hypothesis testing, the purpose of most of these tests are different, or should we say – significantly different. Even in the case of tests that are similar in mechanism and technique, smaller differences are there, whether it’s in the assumptions or the inclusion of an additional element.
Therefore, if you want to compare a population mean with a given standard, or two different population means, a T-test is the test to use. On the other hand, if means of more than two populations need comparing, Six Sigma project managers often use the ANOVA test.
If you are doing a comparison among the variances of two or more populations, the HOV is one of the appropriate tests. On the other hand, comparing the medians of two or more populations can be appropriate for the Mood’s Median test. To compare the differences in output between two or more sub-groups, a Chi-Square Test of Independence is the way to go.
The choice of the hypothesis depends on the needs of the Six Sigma data analytics. The broader goal in Six Sigma remains that we have to move the process mean and restrict the standard deviation to a minimum. The decisions are based on sample data because of the cost-effectiveness, rather than an exhaustive study of the total population. Hypothesis testing enables Six Sigma teams to decide whether there are different population parameters, or the difference, if any, is due to sample variations.
Once the Six Sigma team understands the problem it can correlate the practical difference in outcomes with the statistical differences found in testing. The hypothesis testing identifies the difference. The selection of the test type, in turn, will depend on underlying factors. Is the difference a change in the mean or the variance, for instance?
Planning to become a skilled Data Analyst? Learn Data Science from scratch with OdinSchool's Data Science Course and get dedicated placement assistance!