
How do you determine the Root Cause?
Introduction
Before we move to the subject let me share a short story.
Once during my bachelor days in a new town, I went to see a doctor. I was running a high fever and was unwell for the last couple of days. Having examined me, he concluded it is Malaria. He prescribed some medicines and treated me. I was back on my feet and at work within a couple of days.
I do not contract illnesses very often and usually do take good care of myself. Despite that, it came back in a month’s time. The doctor again gave me some medicines and treated me. Once I was better, I asked him for advice on how to stop recurrence of the illness. The answer he gave was simple – keep your surroundings free from mosquitoes.
You would be thinking- that indeed is simple, why did I not realise that earlier. Well, happens in many situations!
I was seeking a cure for the symptoms earlier. To end the recurrence, I had to identify and remove the cause.
To eliminate or solve a problem, it is imperative to go to the root of the same. Go to the “Root Cause” and eliminate the problem.
What is Root Cause Analysis (RCA)?
Let me take the above story and related analogy forward.
The root cause of the problem in the story was unhealthy surroundings near my house. Once I keep the surroundings clean, I eliminate mosquitoes. I stop or reduce recurrence of the illness.
Root cause analysis is the means to get to the underlying cause of the problem.
Eliminate the root cause of the problem, so you eliminate or reduce the recurrence of the problem. This is where Root cause analysis concept and related tools are useful.
Why Root Cause Analysis?
Today’s fast-paced environment compels organizations to continually innovate. Innovate both on products and service offerings.
A leading organization running pizza chain outlets is a case in point. Growing at a steady pace, increasing geographical reach as well. Their concern - even loyal customers complaining about the quality of their product.
They conducted a review of the problem. They need to increase the richness of the toppings used in their popular pizza offerings. I am one of their loyal customers. Having been to one of their outlets recently, the look and taste of the revamped product surprised me. Did me and my family like the new offering – you bet!
It is not good enough to only look at problems and related causes at a high level. Digging down to identify the root cause is hard work, but essential! Especially for organizations that are looking to improve continuously.
How to conduct Root Cause Analysis?
There are various tools available for conducting Root Cause Analysis process; we will talk about it in detail later in this article.
Root Cause Analysis steps are -
- Define the problem
- Ensure you identify the problem and align with a customer need
- If not existing, anticipate the problem from a customer perspective
- What are the specific issues you observe
- What happens if you do not tackle the problem now – what is the business impact
- Collect data relating to the problem
- Is there data to support the specific problem
- Speak to customers or employees if possible, seek their voice
- Is it a recurring problem, how frequent in the past
- What is the measurable impact of the problem on Key Customer Outcomes
- Identify what is causing the problem
- Identify the underlying cause
- What is the factor or combination thereof leading to this
- Identify as many causes as possible, do not think of solutions at this stage
- Involve your teams and relevant stakeholders
- Use 5Y or Fishbone analysis, more about it later
- Prioritise the causes
- Do not tackle all at once, prioritise
- PICK matrix is a good tool to achieve this
- Bear in mind the impact and effort when you prioritise
- Technology might be a key differentiator at this stage
- Identify solutions to the underlying problem and implement the change
- Focus is on eliminating the problem so it does not recur
- Who will implement the change and by when
- Who is responsible to monitor and control the new process
- What is the method and frequency of reporting performance
- Monitor and sustain
- Defining a solution is not enough, execution is the key
- Embed the new process within the existing business processes
- Ensure the impact of the improvements are monitored and sustained
The process above defines at a simplistic level how Root Cause problem solving blends into the operational excellence culture. The application may differ depending on the criticality of the problem.
Root Cause Analysis Methods
Root Cause Analysis is a simple technique performed with the objective of understanding the cause of the problem.
There are some popular tools in use. Let’s understand each of them.
1. 5 Why Analysis
Very simply described, this technique is about asking “Why?” five times or more. Objective is to arrive at the underlying root cause to the problem.
Figure 1
Image source - http://www.educational-business-articles.com/5-whys/
A simple problem of over-speeding resolves by replacing the alarm clock. Or being more disciplined about changing the batteries.
Now, replace this in a business scenario for a take-away restaurant.
A delay in food delivery might be due to traffic snarl. The underlying cause might be a faulty appliance in the kitchen.
In either case, this tool is important since it focuses on the root cause of the problem. It seeks to eliminate the same so the problem does not recur.
2. Fishbone or Ishikawa Diagram
Ishikawa Diagram is named after Dr. Kaoru Ishikawa. Dr. Ishikawa developed a simple method of displaying the causes of a problem. This diagram went on to be known as the Ishikawa or Fishbone or Cause & Effect Diagram.
The steps to depicting cause and effect on a Fishbone diagram are-
- Define your problem
- Brainstorm with the team on possible causes for the problem
- Use the 6 Ms while doing so
- Man – people performing the process or involved
- Machine – equipment and tools used within the process
- Method – procedures followed
- Material – Inputs required within the process
- Measurement – data on input or product specifications
- Mother nature – environment in which men and machines operate
- Categorise all the causes as per the 6Ms
The final depiction would look like the figure below. As you can see from Figure 2, it looks like a Fishbone, and that’s why the name.
Figure 2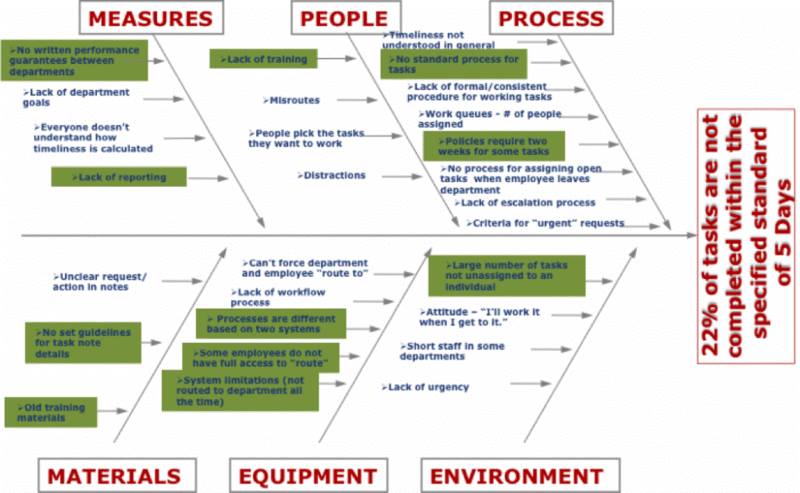
Image source - https://goleansixsigma.com/achieving-a-19-improvement-in-response-time-using-a-cause-and-effect-diagram/ - Prioritise basis data and team view. In the above diagram, the team believes the highlighted causes are the major contributory factors.
- Brainstorm solutions for the prioritised causes and implement
The Fishbone or Cause & Effect Diagram is an impactful tool. It represents all possible causes and prompts the team to think from a 6M perspective.
There are other variations to the 6M.
Some manufacturing companies use 4M (Man, Machine, Material, Method). While some service companies use 8P (Physical Evidence, People, Place, Service, Price, Promotion, Process, Productivity and Quality).
3. Pareto Analysis
Pareto analysis is based on the principle that “80% of the effects come from 20% of the causes”. To put it differently, “20% of the work creates 80% of the results”. This is also called the “80/20” rule.
Look at it either way – the focus is on the “vital few” as opposed to the “trivial many”.
Any problem that we start reviewing, you would experience a tendency to move towards the trivial causes. Our energies need to focus on the “vital few” be it from a problem solving or delivery perspective.
Management consultant Joseph M. Juran suggested the principle. He named it after Vilfredo Pareto, an Italian economist. While at the University of Lausanne, Pareto noted the 80/20 connection. He showed that 80% of the land in Italy was owned by 20% of the population.
Steps to conduct a Pareto analysis are-
- Define categories or classifications for the causes
- Collect data from historical sources or collect data through logs
- Assign a time period for which the data pertains to or to be collected
- Calculate the number of occurrences or observations for each of the categories
- Convert the numbers into percentage of total
- Sort the data by numbers, largest to smallest
- Compute cumulative percentages
- Draw a graph using Minitab or Microsoft Excel
Let’s take the example of an Insurance Premium collections process. The problem is high number of queries sent back by clients on invoices raised. The impact is delayed premium collection.
Data table as follows-
| ABC Insurance - Premium collections | |||
| Number of client queries by category | |||
| Period - Jan '17 - Dec '17 | |||
| Category | Number | %age | Cumulative %age |
| Insufficient backup evidence | 115 | 33% | 33% |
| Tax computation mismatch | 101 | 29% | 62% |
| Incomplete documentation | 80 | 23% | 85% |
| Commission rate mismatch | 40 | 11% | 96% |
| Other | 14 | 4% | 100% |
| 350 | |||
The pareto chart as displayed in a graph (using excel) looks as in Figure 3.
Figure 3
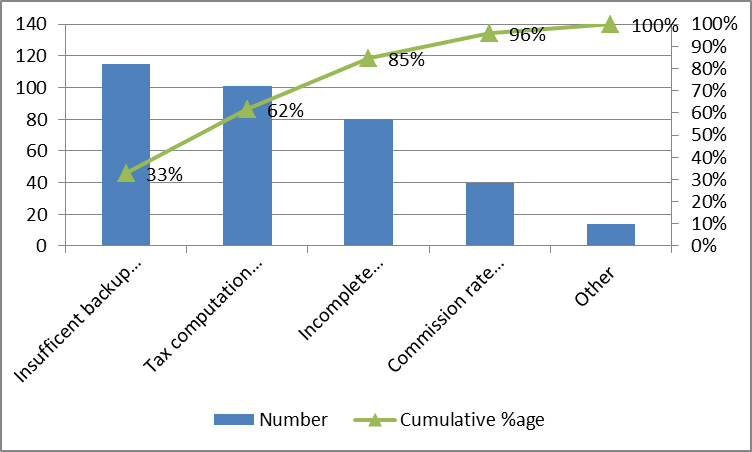
As per the Pareto chart in Figure 3, 85% of the causes for delayed premium collections due to queries are –
- Insufficient backup evidence
- Tax computation mismatch
- Incomplete documentation
- As a team, the focus would be on eliminating or reducing these queries, thereby, positively impacting collections.
4. Brainstorming
As a RCA tool, this is one of the simplest to understand; most difficult to apply.
Brainstorming is getting all the concerned team members into a room. Objective is to understand possible causes to the problem. Focus on solutions only once primary causes are identified.
The process steps are-
- Kick off by champion, attended by process owner, project team, SMEs and Six Sigma team
- Review the problem defined
- Find all possible causes to the problem – hand post-its to attendees and request individual views (no discussions)
- Use 6M to stimulate possible causes
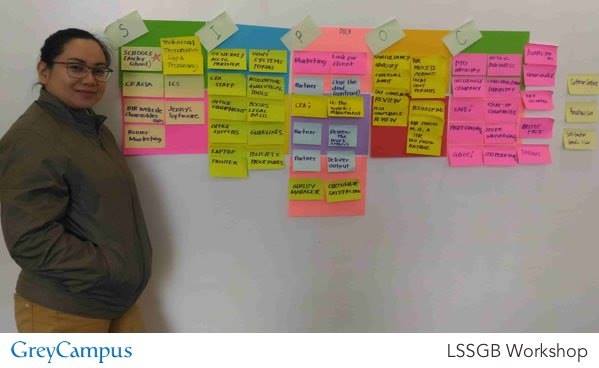
- Categories the causes using Affinity diagram (Figure 4)
- Prioritise the causes, discuss and shortlist possible solutions via voting and group consensus
- Review of shortlisted solutions by Champion for buy-in followed by next steps for subsequent research
- List of further course of action, Minutes of meeting distributed
Brainstorming can generate effective results. In recent times, Brain-writing has evolved as a tool as well.
It is a reformed version of Brainstorming. The focus is on individual view- points initially (at both causation and solution stage).
Figure 4
In a nutshell
Six Sigma popularly gets perceived as a techy space. The reality is – simplistic tools like Root Cause Analysis blends into the operational excellence culture effectively. It is a common sense approach to problem-solving.
Hope you liked reading this article. Feedback through the discussion forum link. Let me know in case you need any further information on any of the concepts by commenting here.
Discover more tools to improve your efficiency – Get Certified Now!