How to use a Fishbone Diagram?
Kaoru Ishikawa invented the fishbone diagram in the 1960s. He was a Japanese professor and a quality management innovator of his time. He used this tool for the first time when he worked with the Kawasaki shipyards in the quality management process. The fishbone diagram is also known as the Ishikawa diagram, as a tribute to its creator.
What is a fishbone diagram?
A fish-bone diagram is one of the seven quality circles (QC) tools. It helps to visualize the potential causes in order to find the root cause of a particular problem. It helps to identify, analyze and improve quality issues. Sometimes, it can also be helpful to analyze what can go wrong - preventing future problems. It derives its name for its shape which resembles the side view of the skeleton of a fish.
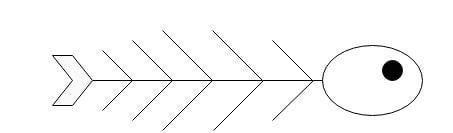
The "head" of the skeleton depicts the problem or effect, which is usually shown on the right. The "bones" extend on the left to show the different causes. The ribs denote categories or classification of causes for the analysis, which branch out into causes and sub causes. The branching depends on the levels required under each classification.
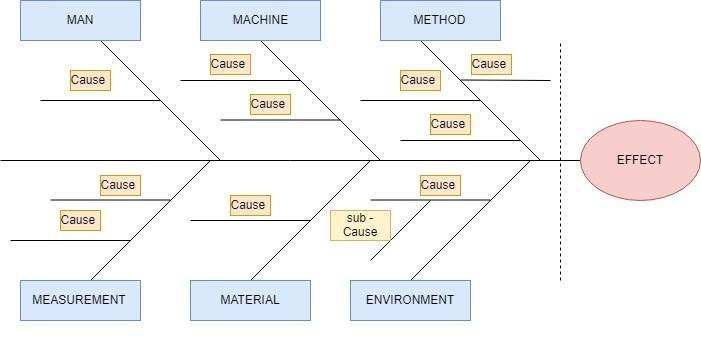
The company Toyota popularized a classification concept of 6 Ms. Sometimes it includes Management and Maintenance along with the categories mentioned below. The 6 general categories of analysis are:
1. Man
2. Machine
3. Material
4. Method
5. Measurement
6. Mother Nature/ Milieu (Environment)
- Some marketing industries use the categories as 7Ps:
1. Product
2. Price
3. Place
4. Promotion
5. People
6. Positioning
7. Packaging
And some Service industries use the 5Ss:
1. Surroundings
2. Suppliers
3. Systems
4. Skills
5. Safety
Drawing a fishbone diagram
-
- Draw the head on the right which contains the problem (effect or issue) for analysis
- Draw a straight line from the head, leading to the left. This is the backbone
- Identify the areas, broad level categories, to be studied and branch them from the backbone.
- Analyze the causes from these categories that contribute to the effect. Connect these causes to the category branches respectively.
- Break down the causes into sub-causes, till you cannot drill down further causes.
Fishbone Analysis
Fishbone diagrams are used in the “Analyze” phase of the DMAIC – define, measure, analyze, improve and control. It is the methodology used for Lean Six Sigma, a problem-solving tool. This diagram is also complemented with “why-why” analysis.
The causes in each area are by a drill-down approach in the context of the problem (effect). These causes can also be further broken into sub-causes for further analysis. Sometimes, it is also called a Cause-and-Effect diagram, giving importance to the causes.
Common uses of the fishbone diagram are to identify:
- Potential causes of problems in new product design
- Prevention of quality defect
- Potential factors that can cause the defect
- Identify the symptoms of the cause
The process of creating a fish-bone diagram can be for either an individual or a team of several people. The first step is to identify the problem. Sometimes the problem can seem to be a symptom too. It is important to understand that the heart of the fishbone is not the effect, problem or symptom, but the cause of it. Once the problem has been found out, a brainstorming session will take place, individually or in a group, to find the causes. The people involved should come up with all the possible causes of the effect.
A step-by-step guide to find the causes:
1. Identify the problem to be analyzed
2. Take up categories of causes for analysis. Here, taking the categories of 6Ms, ask the following questions:
Man: Any man/people related causes to the problem?
Machine: What are the machine-related problems?
Method: What is wrong in the method associated that is giving rise to the problem?
Measurement: Any tool or standard error that needs rectification?
Material: What changes in the properties of the material that occurred?
Environment: What were the environmental conditions (temperature, pressure, etc)?
3. Drill down further, by asking “Why” to the first level of causes.
4. Note these cases against the major categories.
After all the possible and potential causes have been identified, these causes must be rated. The rating is done based on the impact of the cause on the effect. The rating will decide the importance and criticality of the cause and shall be worked upon. The brainstorming session will continue to rate the different causes. Based on the highest rating, the solutions will be proposed.
Advantages and Disadvantages of Fishbone
.png)
Important care to be taken:
The problem should be clear.
There should be no doubts regarding the problem.
The individual or the team member who are trying to identify the causes should be experienced. This prevents from missing out important causes of the problem.
The brainstorming session should be focused and objective oriented. All possible causes should be identified. Only after all the causes are identified, they are rated. If the bones increase, the clarity of the fishbone diagram must not be lost.
Fishbone Diagram Example
Example 1: XYZ Manufacturing Pvt. Ltd.
XYZ Manufacturing Pvt. Ltd has a production unit that produces iron nails. Recently, they started facing the issue of the nails not conforming to their standard dimensions. Also, the nails were rusted by the time they were set for delivery. Here is the fishbone diagram for the company.
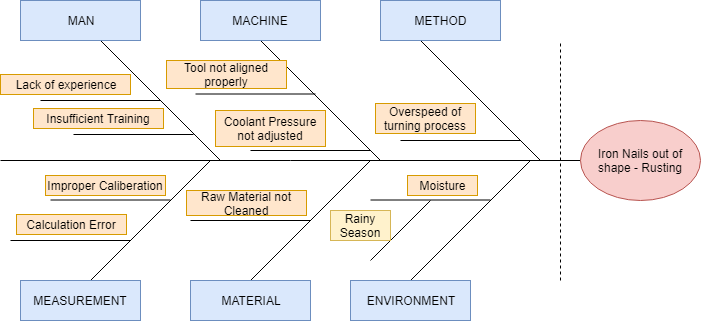
The main problem is shown on the right, “Iron nails out of shape – rusting”. This means that the problem that is dealt with is the incorrect dimensions of the nails due to rust. The nails are rusty and out of dimension. Then the main categories are identified and the potential causes from each of the categories are identified.
The man category has two causes. There is a cause that the workman working on the nails production does not have enough training or that he or she is not experienced enough with the machines, method or working process of the iron nails. As a solution, the organization could give adequate training to the workmen working on the nails production unit.
Machine: The tool used to shape the nail was not aligned accordingly. The pressure of the coolant that is used to mitigate the heat developed during machining caused the movement of the workpiece – leading to a discrepancy of alignment. A thorough check of the machine and the machining operations should be done to get the desired nails.
Method: The turning process, the workpiece moved too fast which lead to a distorted dimension of the nail.
Measurement systems like tools are referred to here. The tools may not be correctly used for measuring the material. There could have been calculation errors
Material: The raw material was not cleaned properly because of this the nail was out of dimension when a machining operation was conducted on the nail.
The environment category has a cause and a sub-cause. The cause is moisture. Why was there moisture in the atmosphere? Answer: It was the rainy season. This is the root cause from the Environment category. Now, the company can look for solutions on how to overcome the problem of moisture content, especially if it was rainy or humid weather.
One important point to note is that the categories mentioned are only to give a sense of direction. All problems may not have caused by each of these categories. The categories can be changed depending on the problem or industry.
Example 2: ABC Pvt. Ltd
A company, ABC Pvt. Ltd. identified that their sales of a particular Product A fell by 36% in June this year. The company decided to find the root cause of fishbone analysis. This is the diagram that was projected.
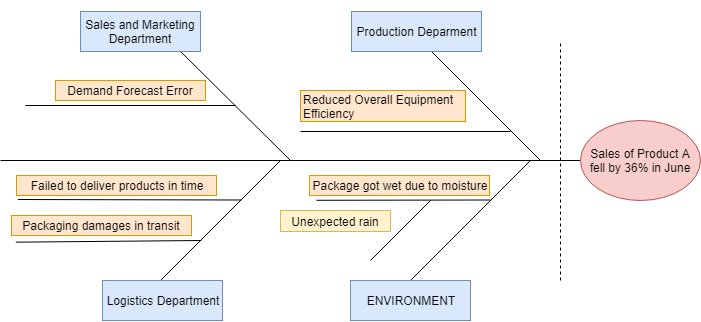
The example shows that there are no six categories and only one of them is used, that is the Environment. Also, the company wishes to study the department wise causes of the problems and thus they have categorized the causes into three key departments and noted the respective causes. A simple technique to drill down the causes is to ask, “Why” to every cause. For example: Why did the package get wet due to moisture? Answer: Unexpected Rain
Summary
It is a very important tool in identifying the root cause, though its development is time-consuming. Owing to its enormous benefits, the fishbone diagram is used across different industries like manufacturing, project management, service industries, etc.
The value of the fishbone diagram depends on how the diagram is developed. The experience level, knowledge, critical thinking, training, etc. of the person or people involved play a major role in the successful drafting of the fish-bone diagram. It is important to involve experienced experts to draft the fishbone diagram and ask many as “whys” to find the root cause.
What’s next? Become a Quality Expert. Register now!