
9 Powerful Excel Features To Boost Your Productivity
Excel is one of the most used business tools in the world. Knowledge of excel features is a must have skill. There are several add-ons available in Excel for creating reports. We present nine of them to improve your productivity at the workplace.
Heat Map: This template can be used to present data in different color format. It is visually appealing and can make the data easy to understand.
The heat map in Excel can be used in any of the following:
- Conditional Formatting (using color scales)
- Dynamic template
- Geographical template
- Pivot tables
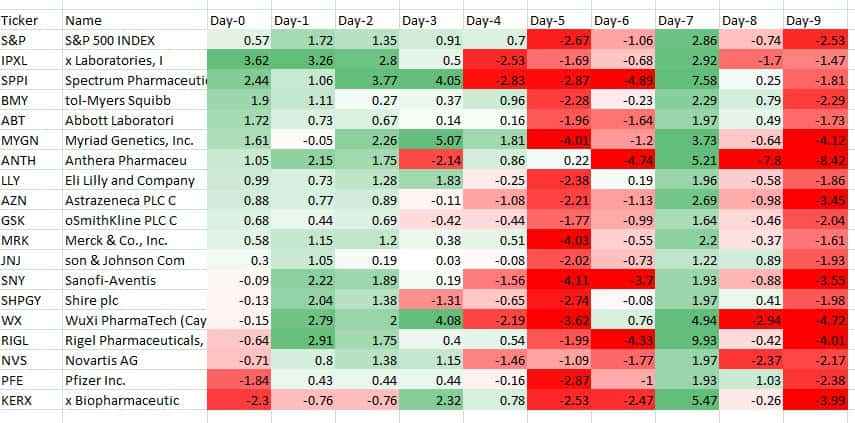
Source: traderslaboratory.com
To know more about Heat Map, please visit: http://excelchamps.com/blog/2016/07/excel-heat-map-template/
Brush Tools: If there are any formulas in Excel, you can make them stand out. This add-on helps you know the difference in the formulas through colors.
As the name suggests, the add-on brushes the formula content in different colors. This helps to know the kind of data displayed. The data can be anything from inputs,links,calculations.
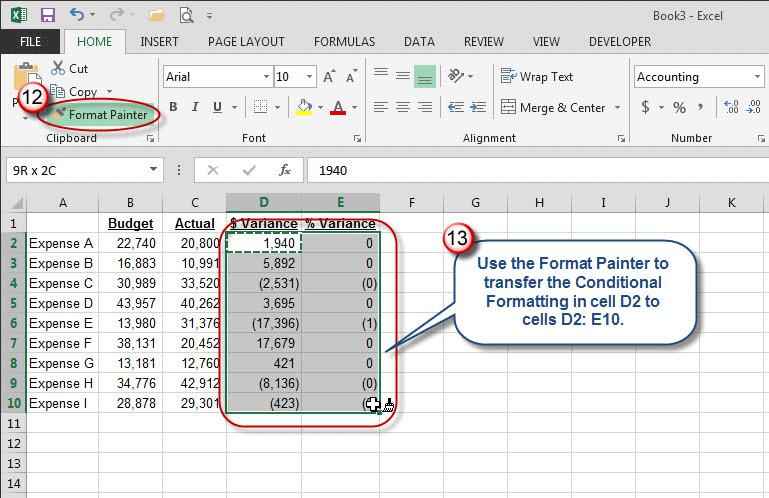
Source: accountingweb.com
Bubbles: This add-on is used to represent data as bubbles of different size and colors. You can add text or numbers in the bubbles to show the many kinds of data.
In a typical scatter chart, we have data points that show information. A bubble chart is a variation where the data points are shown as bubbles. You can play with colors and change sizes of bubbles. Many analysts use this add-on as it is fun to work with.
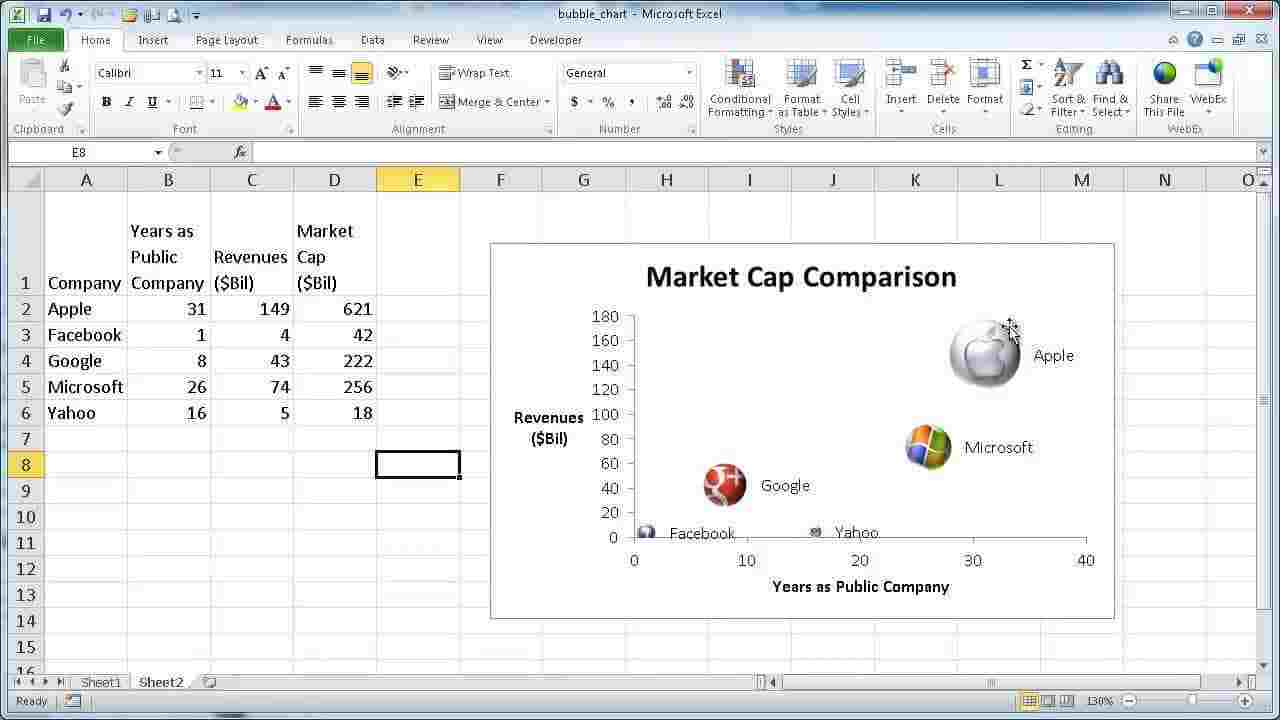
Source: youtube.com
To know more about Bubbles, please visit: https://store.office.com/en-001/app.aspx?assetid=WA103147117&ui=en-US&rs=en-001&ad=US&appredirect=false
Radial Bar Chart: This add-on is another way of presenting large and complex information. Polar coordinates are used to show the data in a circular format.
Different colors show you what kind of data is in the system. This is visually appealing while creating reports and is a fun way to visualize your data.
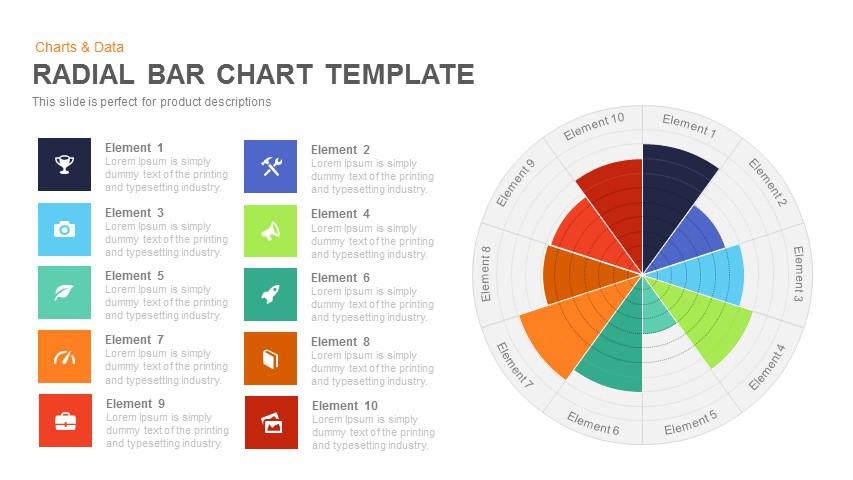
Source: slidebazaar.com
To know more about Radial Bar Chart, please visit:https://appsource.microsoft.com/en-us/product/office/WA103857593
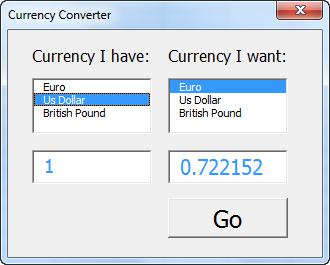
Exchange Rate Converter: Analysts working with financial data use this add-on the most. It is regularly updated and converts value of more than 160 currencies.
It is compatible with different versions of operating systems. It is easy to use and anyone can use it to get results. There are two versions available for private and professional use for this add-on.
Source: excel-easy.com
To know more about Exchange Rate Converter, please visit:http://www.office-plugins.net/free-excel-currency-converter/
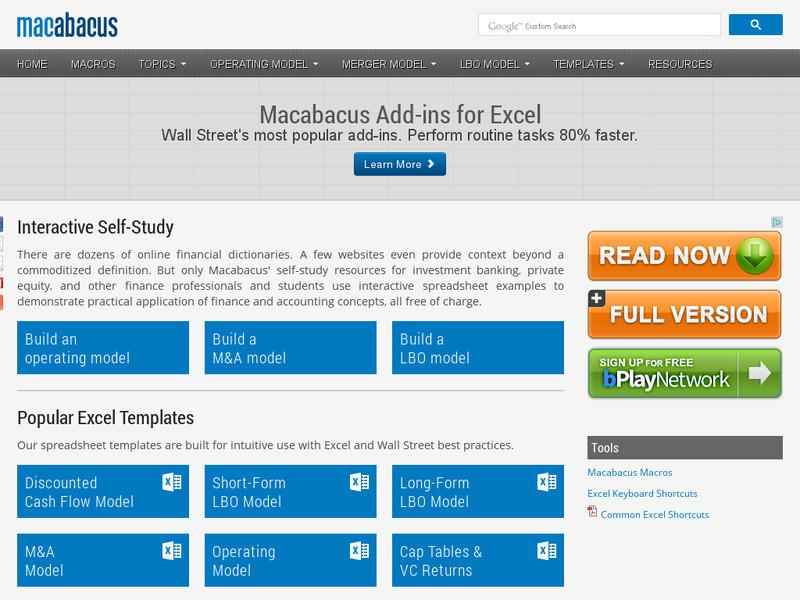
Macabacus: This is one of the leading suites designed for finance and other professionals. It consists of more than 200 features to improve productivity at work.
Tools are available for data analysis, modelling, auditing and more. It saves almost 80% of time for routine tasks and easily links to Excel. Many companies use this classy suite for everyday work.
Source: dig.do
To know more Macabacus, please visit:http://macabacus.com/
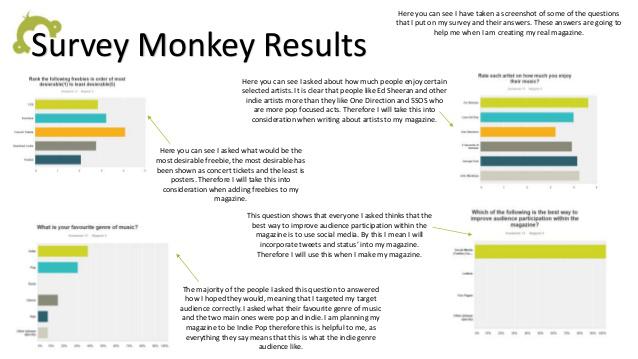
Survey Monkey: A web based survey solution that offers some of the best results for data reports. It is simple to use by anyone and does not need any software.
If you want to import data from the survey, it is easy to transfer data to a spreadsheet/dashboard. You can customize templates suited to your needs. You can download results with just a few clicks.
Source: slideshare.net
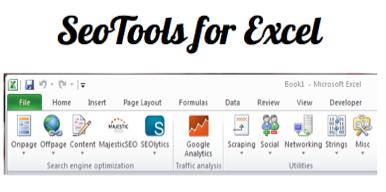
SEO Tools: This is a powerful tool for online marketing. It integrates data from various platforms to identify trends. These platforms include Google Adwords, Google Analytics, Majestic SEO, SEMrush and the likes.
This add-on helps load SEO data into Excel so you can analyse it for patterns/trends. The data will help you take informed decisions to attract more traffic to your site.
Source: nulled-scripts.xyz
To know more about SEO Tools, please visit: http://seotoolsforexcel.com/
Power BI: This is one of the leading tools for business analytics. Power BI takes the data and converts it into rich visuals. You can create dashboards with high quality visual data.
Insights can be derived from such data to take decisions for business success. The data is shared across devices for ease of use and security. You can analyse vast amounts of data in a few seconds as it integrates data from many sources.
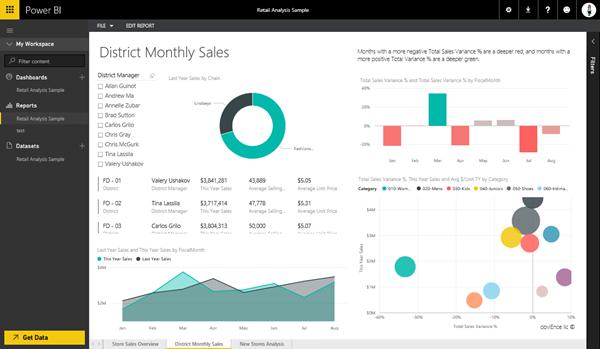
Source: powerbi.microsoft.com
To learn more about PowerBI, please visit: https://powerbi.microsoft.com/en-us/
These nine Excel add-ons will help you make better reports and save a lot of time. You can complete tasks which otherwise would have taken a lot of your time. If you would like to master these powerful features you can enroll for an Excel Certification Course.
This will ensure your productivity at work will be more and you will be able to create high quality reports.