
Planned Value (PV), Earned Value (EV) & Actual Cost (AC) in Project Cost Management
We’ve all come to understand project management as the application of knowledge, skills, and tools that help you achieve the project’s requirements or objectives. Albeit, it might surprise you that many projects still fail to meet the intended results even when you take all the necessary measures and appropriate processes for a successful project.
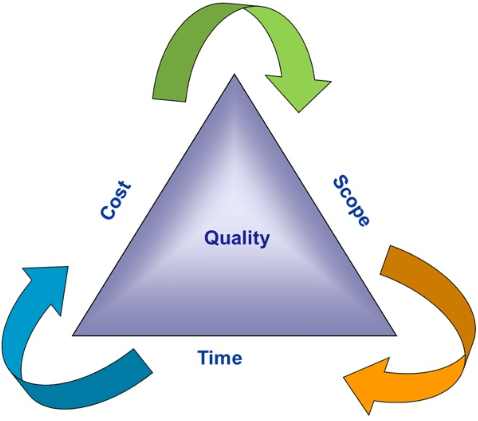
Successful project management is achieving a continuous stream of project objectives within time, cost, and at the desired performance or technology level. This involves the effective and efficient use of the assigned resources to produce products, results, or services that the customer accepts.
One of the key requirements for a successful project is to achieve expected results, objectives, or services within the allocated project budget. The only way to achieve such is to manage the project cost-efficiently as per the Cost Management Plan.
Project Cost Management
Project Cost Management is a process that involves planning, management, and control of the project to comply with the approved budget. It provides guidance and direction on how you’ll manage the project’s costs throughout the project. This primarily deals with the cost of resources required to complete the project activities.
Cost Management ensures that project funding and dispersal happens in a phased manner. So, project execution happens unabated according to the approved plan. These processes are project-specific and appropriately picked by the project team.
The Project Managers monitor the project performance throughout its duration. In that way, the project team can control the performance deviations that may occur during the project duration. This method that the team employs here is the Earned Value Management System (EVMS).
You may also like: Project Management: How to collect requirements for your project effectively? |
Earned Value Management System (EVMS)
Earned Value Management System (EVMS) is a performance measurement baseline. It’s a systematic process for measuring the project performance at any given point in time within the project phase. It integrates project scope baseline with cost baseline and schedule baseline.
The EVMS monitors the following three key dimensions:
- Planned Value (PV)
- Earned Value (EV)
- Actual Cost (AC)
The key benefits of using EVMS are:
- Accurate display of project status
- Early and accurate identification of trends
- Early and accurate identification of problems
- The basis for course corrections
EVMS can answer the following questions at any given point project phase:
- What is the exact and true status of the project?
- What are the issues?
- What must you do to fix the issues?
- What is the impact of these issues on the project’s performance?
- What are the present and future risks?
EVMS notifies you early of trends and variances from the plan. Thus, allowing the project manager sufficient time to take necessary measures before the issues get bigger.
Let’s analyze these terms based on PMBoK 6th edition,
You may also like: Project Deliverables: What are they and why are they important? |
Planned Value (PV)
Planned value is the authorized budget you assign to an activity or work breakdown structure (WBS). This budget doesn’t include a management reserve.
You allocate the planned value in phases over the lifetime of the project. Albeit, at a given point in time, planned value defines the physical work that you’ve accomplished.
The total PV is also known as performance measurement baseline (PMB), budget at completion (BAC), or more often as Budgeted Cost of Work Scheduled (BCWS).
You can calculate Planned Value (PV) using the relation:
PV= BAC x Planned % of complete.
The following example illustrates the relationship:
A project ABC is planned for 15 months with a budget (BAC) of USD 150,000. If the scheduled percentage of work completed after three months is 20%, the planned value after three months would be:
PV= 150000 x 20% = 150000x(20/100) = USD 30,000
PV is also a useful tool for calculating Scheduled Performance Index (SPI) and Schedule Variance (SV)
Earned value (EV)
EV is a measure of work performed or the budget authorized for that work. In other words, it’s the budget authorized for completed work. The value of EV cannot be greater than the authorized PV budget for a component.
Since EV calculates the percentage of the project you’ve completed, you’ll measure it with reference to the progress measurement criteria established for each WBS component.
EV is also referred to as Budgeted Cost of Work Performed (BCWP).
To calculate EV, you’d use the relation:
EV = % of work performed/completed x BAC
The following example throws more light on calculating the EV.
A project ABC is planned for 15 months with a budget (BAC) of USD 150,000. The scheduled percent of work completed after three months is 20%. The work completed after the third month is 25%, and the amount spent is USD 30,000. The EV of the project is :
EV= 25% x $150,000 = (25/100) x 150,000 = $37,500
Here, you need not focus on the amount spent. You require only the percentage of work completed.
Of all the tools for assessing project performance, EV is the most important. You’ll use it with PV and AC to calculate:
- Cost Performance Index (CPI)
- Scheduled Performance Index (SPI)
- Cost Variance (CV)
- Schedule Variance (CV)
- To Complete Performance Index (TCPI), and
- Estimate to Completion (EAC).
You may also like: The ultimate guide to 9 essential documents for your project |
Actual cost (AC)
Actual Cost is the realized cost incurred for the work performed on an activity during a specific time period. In other words, the cost you incur while accomplishing the work for which EV is measured.
You measure AC as it relates to PV (budgeted) and EV (measured), but this has no upper limit. whatever you spend to achieve the EV will be measured.
AC is also referred to as the Actual Cost of Work Performed (ACWP). You don’t need the formula to calculate AC because it’s the actual amount spent on performing the planned work, which is illustrated in the following example.
A project ABC is planned for 15 months with a budget (BAC) of USD 150,000. The three months have already passed now, the total amount spent during the period is USD 40,000, and 15% of the work has been accomplished during these months.
From the above case, we can easily note that AC after three months is USD 40,000, and the percentage of work completed is 15%.
If you review the case closely, it is evident that AC ($40,000) is more than PV ($30,000). What this implies is that the project has consumed more budget than planned, so it over-budgeted.
Also, note that the project is trailing against the planned percentage of completion. Instead of 20% complete, it has achieved only 15% work completion. So, the project is behind schedule too.
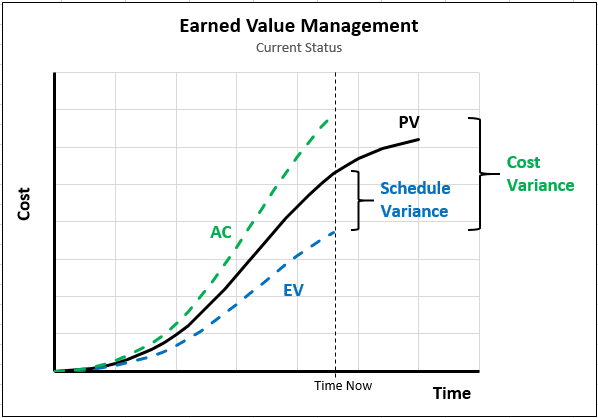
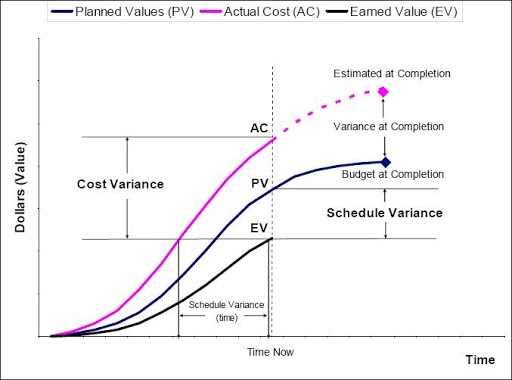
Application of EV
From the image above, you can see that EV is a very important instrument in evaluating project performance. Beyond assisting the project team to understand the project’s health, it helps bring the project back on track in case of any deviations or variations from the plan.
Following the PMBoK 6th edition, project variations are estimated through the following theories.
Variance Analysis
Variance Analysis reviews the differences (or variance) between the planned and actual performance. This can be of the project schedule, cost, other technical performances, or other data analysis.
Here are some of the variations that you can use EV to estimate:
Schedule Variance (SV)
SV analyzes the project performance in terms of the planned project schedule. It helps to understand whether the project is behind or ahead of schedule at a given point in time. This gives information on the magnitude of variation from the schedule baseline.
SV is best used in combination with the Critical Path Method (CPM) scheduling and risk management. Its estimation follows:
SV= EV-PV
Where,
- SV= zero, we can say the project is progressing as per the planned schedule.
- SV= positive, project is progressing ahead of the planned schedule
- SV= negative, project is trailing, may need more time to finish
Example: A project ABC is planned for 15 months with a budget (BAC) of USD 150,000. If the scheduled percent of work completed after three months is 20% and the actual work completion is 15%, Find the schedule variance.
PV= 150000 x 20% = 150000x(20/100) = $30,000
EV: 150000 x 15% = 150000 x (15/100) = $22,500
Therefore the SV= EV-PV = $22,500 - $30,000 = -$7,500
SV is negative; hence the project is behind schedule.
You may also like: RACI Matrix: How does it help Project Managers? |
Schedule Performance Index (SPI)
The Schedule Performance Index of a project is a measure of its schedule efficiency and is expressed as the ratio of earned value to planned value. Hence, its equation is:
SPI = EV/PV
It measures the efficiency of the project team at accomplishing the work. The measurement of SPI is generally in conjunction with the CPM schedule.
As an indicator, if
- SPI=1, the project is as per schedule,
- SPI<1, project is behind the schedule
- SPI>, the project is ahead of schedule
From the last example, we can conclude that:
SPI= 22500/30000 =0.75 < 1, so the project is behind schedule.
Cost Variance (CV)
Cost Variance has a direct relationship with the project budget. It’s the amount of project budget deficit or surplus at any given point time. This also helps in the prediction of the budget at project completion.
CV is very critical because it indicates the relationship between physical performance to the costs spent.
The equation for Cost Variance, CV = EV-AC
If,
- CV= zero, project spending is as per the planned budget (i.e., according to the budget)
- CV= positive, project spending is less than the planned budget (i.e., under budget)
- CV= negative, project spending is more than the planned budget (i.e., over budget)
However, a negative value of CV is riskier for the project than any other scenario.
Here’s an example.
Example: A project ABC is planned for 15 months with a budget (BAC) of USD 150,000. The scheduled percentage of work completed after three months is 20% and the actual work completion is 35%. The amount spent to date is USD 40,000. Find the cost variance.
EV: 150000 x 35% = 150000 x (35/100) = $52,500
AC = Amount spent till date = $40,000
Therefore the CV= EV - AC = $52,500 - $40,000 = $12,500
CV is positive; hence project is under the budget.
You may also like: 8 Common Types of Organizational Structures in Project Management |
Cost Performance Index (CPI)
Cost Performance Index is a measure of cost efficiency of budgeted resources, expressed as a ratio of earned value to actual cost.
Hence, the equation:
CPI= EV/AC
CPI is considered the most critical metric and measures the cost efficiency of the work completed.
As an indicator, if
- CPI=1, the project cost is as budgeted
- CPI<1, the project is over budgeted (cost overrun for work completed)
- CPI>, the project is under-budgeted (cost underrun of performance to date)
So, using the example above, we can conclude that,
CPI= EV/AC = 52500/40000= 1.31 >1, project has cost underrun (under-budgeted)
Practical Limitations
While trying to understand the EVM, you may notice certain limitations in the practical applications. A few of them are:
- CV actually measures the cost efficiency of the physical work accomplished compared to the plan, despite the fact that you measure it in dollars (or any currency). To correct the negative CV, you prioritize the productivity rate (i.e., burn rate) at which the work is being performed.
- The SV measures the timelines of the physical progress compared to the plan. When there is negative SV, the best thing to do is to improve the speed of work.
- CV relates to the real cost, while SV shows the real schedule. You can determine SV from the cost account or work package costs, but it doesn’t necessarily relate to the real schedule. SV doesn’t distinguish between the critical and non-critical path work packages.
- SV by itself doesn’t measure time. Plus a negative SV indicates that the project is behind schedule, but doesn’t indicate the slippage from the critical path.
Summary
Earned value management is an important aspect of project management. EV, PV, and AC are the most important instruments in assessing project performance at any given point in time.
The project manager must use these tools to take necessary corrective or preventive measures while analyzing the project’s health. The tools play a vital role in predicting project completion with respect to the allocated budget and time. The project team would also find them useful for generating project status reports.
You’ll find some of the formulae in the table below:
Sl | Key Term | Abbreviation | Brief Description | Formula |
1 | Planned Value | PV (BCWS) | Budgeted Cost of the Work Scheduled or Cost allocated for a particular activity/ work in the project. | PV= BAC x Planned % of complete |
2 | Actual Cost | AC (ACWP) | Actual Cost of the Work performed, or Cost incurred in performing/completing a particular task/work in the project. | No formula, It is derived from the amount spent on the work |
3 | Earned Value | EV (BCWP) | Value of the task/work performed at a given point of time against the budget. | EV = % of work performed/completed x BAC |
4 | Schedule Variance | SV | Measures the schedule performance on a project, indicates whether the project is ahead/ behind the schedule. A negative value indicates the project is behind the schedule. | SV = EV-PV |
5 | Cost Variance | CV | Measures the cost performance on a project, indicates whether the project is within/over the budget. A negative value indicates the project is over the budget. | CV = EV-AC |
6 | Schedule Performance Index | SPI | Measures the schedule efficiency on a project, indicates whether the project is ahead/ behind the schedule (rate of work progress), SPI<1 indicates the project is behind the schedule. | SPI = EV/PV |
7 | Cost Performance Index | CPI | Measures the cost efficiency on a project, indicates whether the project is within/over the budget. CPI<1 indicates the project is over the budget. | CPI = EV/AC |
8 | Estimate At Completion | EAC | The expected total cost of scheduled activity/ task/ project | EAC = AC+ (BAC-EV), Use when variances are typical and future efficiencies are different from the past |
EAC = AC+ [(BACEV)/CPI], Use when variances are typical and future efficiencies are going to be similar to the past | ||||
EAC = BAC/CPI, Use when work is performed at the present CPI. | ||||
EAC = AC+ [(BAC-EV)/ {CPIxSPI}], Use when work considers both CPI and SPI factors. | ||||
9 | Estimate To Complete | ETC | The expected cost needed to complete the remaining work for a scheduled activity. | ETC = BAC-EV, Use when variances are typical and future efficiencies are different from the past. |
ETC = (BAC-EV)/CPI, Use when variances are typical and future efficiencies are going to be similar to the past | ||||
ETC= EAC-AC, Use when original estimates were incorrect, and you have new estimates. | ||||
10 | Variance At Completion | VAC | Used to assess the magnitude of variation to the original cost baseline. | VAC = BAC-EAC, Negative value indicates the project will be over the budget. |
11 | To- Complete Performance Index | TCPI | Used to calculate the projected performance that must be achieved on the remaining work to meet a specified management goal. (Calculates cost-performance improvement). | TCPI = (BAC-EV)/ (EACAC), TCPI< 1 indicates the remaining work can be executed at the lower cost performance, TCPI>1 indicates remaining work needs to be executed at the better cost performance to bring it back to 1. |
Click here to kickstart your Project Management career