Why Gantt Chart for Project Management?
Introduction
It is already a known fact that project management has become indispensable across all industries and businesses. We all know that project management is the application of processes, methods, skills, and knowledge to deliver the specific planned project objectives within the given timeline.
While managing the projects, the project team uses different and appropriate project management tools to assist project delivery effectively and efficiently. These tools are generally applied in project scheduling, estimating, reporting, etc., There are many project management tools and techniques available in the industry.
Gantt Chart is one of the best tools that is widely used in project management.
What is the Gantt Chart?
Gantt chart is a horizontal bar chart/graph that is used to show the schedule/progress of the project. This tool as the name suggests was first designed and used by Henry Gantt in 1917. Since then this tool has become so popular almost 67% of the project professionals are using this to list the project activities, scheduling, and the interdependencies between them.
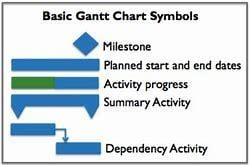
The basic elements of the Gantt chart are:
- The timeline of the project
- Project tasks/activities
- Start and end dates for all the tasks/activities (this gives the total project duration)
- Grouping of the activities under each related milestone/tasks
- Task owner
Gantt Chart as an online software:
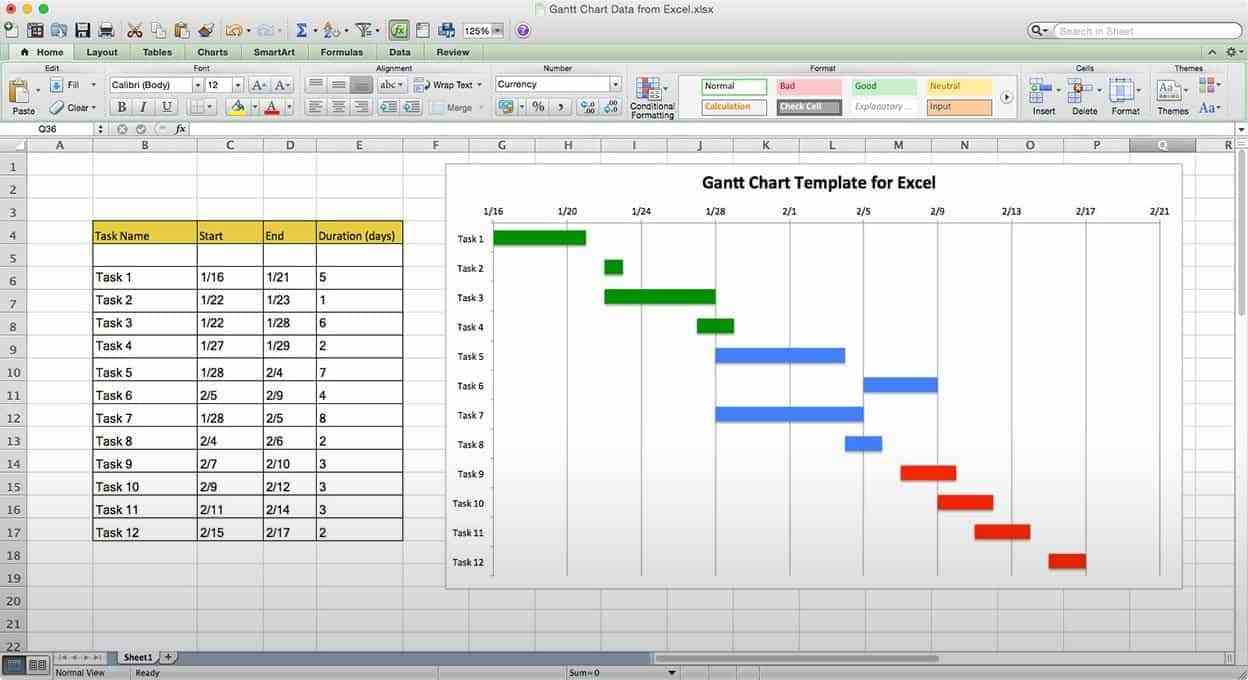
Gantt charts can be made on MS Excel. But this helps project professionals manage their tasks/milestones/projects individually. This would make the team/member work independently, wherein team coordination would be more difficult.
Gantt charts when used as software, works as an interactive tool used across the different functions of the organization as a common tool for the specified project. In this, designated persons from the different teams can see the progress and update the parameters and data about the project activities.
To make the project management even easier, users can automate the chart, can prioritize tasks, indent and outdent, set dependencies, assign, and edit activity durations, lock the activity and even remove the activity if found irrelevant, can see the progress along with activity attributes and share the status online.
This online software extracts the working hours allotted to each activity resource along with activity duration, thus enabling the user to modify and reallocate the available time for each project resource. This helps the user to manage the project /resource time when any particular resource is not available for the allotted/hired time. This tool also supports managing project holidays.
How to Use a Gantt Chart and Collaborate with project Team:
There are many ways to manage the project with Gantt Chart online software. Once you set up all the project information on the chart, you can align the individual tasks concurrently, assign alternate tasks, import the attachments, and share the documents online.
To begin with, the following steps would assist to set up and use the Gantt chart.
- List all the project activities
Once the team prepares the project WBS (Work Breakdown Structure), assign a chart user, list, and group all the project activities.
User can also add the tasks directly by importing excel format files or CSV format files
- Assign team members to the tasks
Once activity listing and grouping is done, you can start assigning the team resource (project member). You can change the resource any time based on resource availability. Once a team member is assigned, the individual names start appearing alongside the taskbar with the project activity.
- Customize Gantt chart
Many times it may be required to modify the chart itself as the project progresses based on the project requirements. Gantt chart supports the user in customizing the chart in whichever way it is needed. Users can view the summary, project status, phases of the project, team assigned to the task, hours allotted, and remaining. You can customize your Gantt chart in whatever way suits your team. This can be highlighted using color configurations.
- Share files, documents, notes or comments
When the project team works on the virtual platform (remotely), the Gantt chart helps to share the documents and attach supporting files, add notes/comments, screenshots/images. Even you can share videos, to enable the team to see the meetings/conferences or any project related information.
- Receive email alerts
The Gantt can also be enabled to receive email alerts. In this way, if there is an update on the project status/info, the team can receive emails instantly notifying the change or update.
- See what is new
Users can customize the Activity page to make the information visible in a single window as a summary. This enables the authorized person to see what his/her team is working on and history on the project update. This is an important feature of the Gantt chart online software.
Setting up advanced features on Gantt Chart:
Setting up advanced features in the Gantt chart is simply setting its columns.
The most commonly used columns in the Gantt chart are:
- Task name: Describe the task/activity
- Planned start date: Activity commencement date as per the approved plan
- Planned duration: Total time allotted for completion of the activity (number of days between planned start and end dates)
- Planned effort: This is the amount of work (effort) required for the completion of the task/ activity (generally in hours). This includes a waiting period wherever applicable.
Eg: If a building wall is required to be finished in two coats of plaster (generally external walls are done in two coats). If the first coat takes 20 hours and the second coat takes 15 hours with a waiting period of 24 hours between the two coats, we can say work requires 35 hours (effort) to finish the plastering but needs 59 hours (duration) to complete.
- Percentage of work complete: This gives a status on work completion. Quantity of work done and quantity remaining.
- Resource Assigned: This gives information on the name of the team member assigned to the task, type of resource, etc., This is required and helpful to know whenever there is a need to change the resource during the project execution, as many times resources have limited availability.
- Task Dependencies: Use can link the tasks to show their dependencies. By assigning the task numbers against the preceding or succeeding tasks you can show when to start and how to end tasks. (Many times activities are linked in such a way that two tasks are planned concurrently such that one to start after completing the other task partially)
Source: www.bing.com/image
Benefits of Gantt chart:
It is already understood that the Gantt chart as a tool or online software helps the project management team work collaboratively across all the platforms and locations.
One of the key benefits of the Gantt chart project management tool is increased productivity. Once the chart is done, you can edit it whenever needed until the project gets completed. You can share all the project related information instantly and receive feedback/comments quickly from the concerned.
As the chart is integrated with the calendar, this tool incorporates every project/project plan information, all resources can extract the relevant information wherever they are, thereby bringing the team single page. Hence, make the project monitoring much easier.
As the chart shows the task owner with the task name on the project timeline, it is very convenient to monitor the workload on the individual. This feature helps the user to share the workload, and can identify the substitutes in case the resource has limited availability.
Also, we can monitor the plan efficiency while monitoring the task dependencies, and whenever required the user can shuffle the same if found improper.
Some of the other key benefits of Gantt chart are listed as follows:
- Gantt charts simplify the complex project plans, workflows into easily manageable activities
- Projects and tasks/activities, priorities can easily be organized.
- Assist in identifying the project plan feasibility (works or not), sets realistic timeframe.
- It helps in identifying the project critical path.
- Facilitate in achieving project objectives by making the project plan realistic.
- Supports the team to keep control over the project progress by providing transparent visualization
- Helps in identifying project risks in terms of delay, overload, resource availability, etc.,
Who uses a Gantt Chart?
Where can the Gantt chart fit in? To whom it is most suitable? Such questions can arise in everyone’s mind. But, today, nearly every professional can make use of this Gantt chart, to make their work/business work faster, smoother, and efficiently.
As most of the works (projects in particular) are longer, complex, involving different types of resources, agencies, and many more people to manage a long list of tasks/activities, it is required to manage such complex works on a computer. This is more so when resources are spread across different geographical locations. Hence, everyone needs a system that makes their business easier and automated.
Gantt Charts today are the need of every business and industry. Once the user makes a simple list of the tasks/activities with start and end dates, Gantt chart software does the rest of the work.
Gantt chart users can be grouped based on their function, role, etc., The following list gives more insight on the same.
Gantt Chart Users by Role
Users under this list are:
- Project Managers
- Team Leaders
- Operations Managers
- Scheduling managers
- General Managers
- Work Managers
Most of the time, the trained or experienced professionals are appropriate to use the Gantt charts rather than unskilled professionals. Since this software is meant to make the works easier, it should not result in other ways by allowing unskilled/untrained professionals, as creating long task lists and complex schedules demand proper experience and training. Gantt charts are the exclusive planning tools for large and complex projects like construction, military, manufacturing, engineering, infrastructure, IT/Software, and many more.
You may also like: Planned Value (PV), Earned Value (EV) & Actual Cost (AC) in Project Cost Management
Gantt Chart Users by Team
Since projects run collaboratively involving different team members from different functions and different skill sets, the collaborative feature of Gantt chart software, all the team members can work on a single platform watching and tracking their work progress and sync all work together.
The type of the teams which can use the Gantt charts can be listed as follows:
- The project team in general working on various projects
- IT & Development Teams
- Marketing Teams
- Professional Services Teams
- Engineering & Architectural Teams
- Project Management Teams
- Project Management Offices
- Product Development Teams
- Healthcare Teams
- Public Works Teams
- Oil & Gas Industry teams
- Construction Teams
- Manufacturing Teams
- Remotely working Teams
- Telecommunications Teams
- Government Teams…so on this list still goes longer
Examples and templates of Gantt charts:
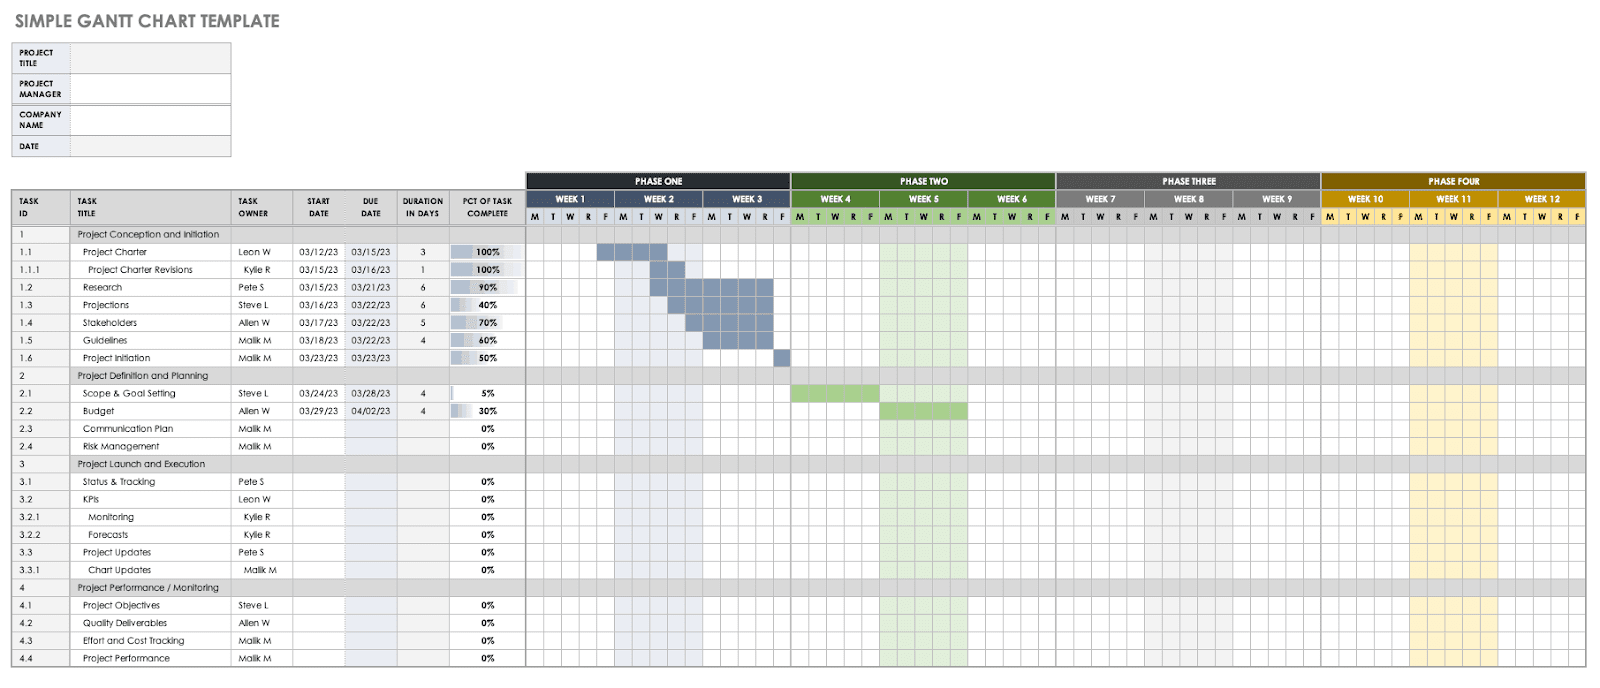
Source: www.bing.com/images
Comparing the Gantt Chart with other management tools:
Timeline:
Though the Gantt chart and Timeline appear to be the same and almost in a similar way, they differ slightly in their application.
In Gantt chart activities/tasks are tabulated with links and dependencies among them whereas, in the Timeline chart, tasks /events are divided by specific intervals and are arranged chronologically.
The other difference is about task grouping. Gantt chart organizes the task/activities into logical groupings along with task owner/s to make the project look quite instinctive, whereas the Timeline chart does not offer all these features but with limited information.
Overall from the user point of view and irrespective of the project management methodology (Agile or Waterfall), the Timeline chart helps in planning and sharing project status better.
PERT:
PERT stands for Program Evaluation and Review Technique
The key difference between the Gantt chart and PERT is in their appearances.
Gantt chart is a horizontal bar graph with an X-axis containing dates and a Y-axis activity list, each bar length showing the duration of the activity with start and end dates. Whereas PERT charts are network diagrams with boxes representing the activity and arrows connecting the boxes shows the dependencies among the activity, arranged from left to right.
Gantt charts show the subtasks grouped under task and dependencies are shown by an activity number which will draw an arrow to connect dependent tasks. Whereas in the PERT chart dependencies are shown by arrows only.
As the Y-axis in Gantt chart is linked to the calendar showing days, weeks, and months, it is more convenient to monitor activity start dates, delays and also to know the tasks which are not on the schedule. PERT chart, on the other hand, does not show the scheduled dates and hence less convenient to manage deadlines.
CPM:
This is an acronym for the Critical Path Method.
Gantt chart is a horizontal bar graph whereas the CPM chart is a graphical view focussed mainly on the network of events.
Gantt chart shows the schedule of activities to be managed as per the project schedule, on the other hand, the CPM chart works on the sequencing of activities, connecting critical tasks (the tasks that are on project critical path) which must be managed with key attention to avoid schedule slippage.
Roadmap:
We all know about the Gantt chart which is a horizontal bar graph having all project activities listed with start and end dates. Each bar depicts the duration of that particular task/activity.
Roadmap, on the other hand, provides a simple way of prioritizing the activities based on the value they deliver from the customer and business point of view. This is specifically prepared while managing stakeholder expectations. This falls under the Agile method of project management.
Roadmaps are prepared to share the project/product vision and path ahead. Roadmaps are very flexible and keep on changing based on customer feedback about the product.
Conclusion:
There are many management tools invented after the Gantt chart, but until today the Gantt chart is regarded as the most widely used project management tool and many times considered as a world standard. This is the best tool among the competitors and for the project managers to construct project schedules and manage them against time.
Gantt charts with its user-friendly and simplicity, make project professionals rely on this. The tool offers a wide range of features like visualizing different tasks, activity dependencies, time limitations, and tracking of project progress against schedule. Thus facilitating the project managers to manage and complete the project as per the plan.
With the advancement in the tool and added features, project managers now are able to create more complex project schedules for larger projects quite comfortably. Thus making the project managers more respected and proficient professionals in the project management domain.