
Data Types In Six Sigma Measure Phase
Six Sigma is a statistical approach which aims at achieving breakthrough improvement by reducing variation and defects. One of the most common six sigma framework is the DMAIC approach.
Six Sigma is considered more important over other quality improvement techniques as -
- It helps in increasing customer satisfaction since it considers anything which does not meet customer requirements as a defect.
- It is a data-driven approach which focuses on the use of statistics and figures rather than gut feelings and notions.
- It helps continuously to improve the process until it is optimized completely.
- It ensures superior quality products with reduced defects and variations.
Six Sigma means 3.4 defects in a million opportunities. The higher the sigma, lower the defect rate is.
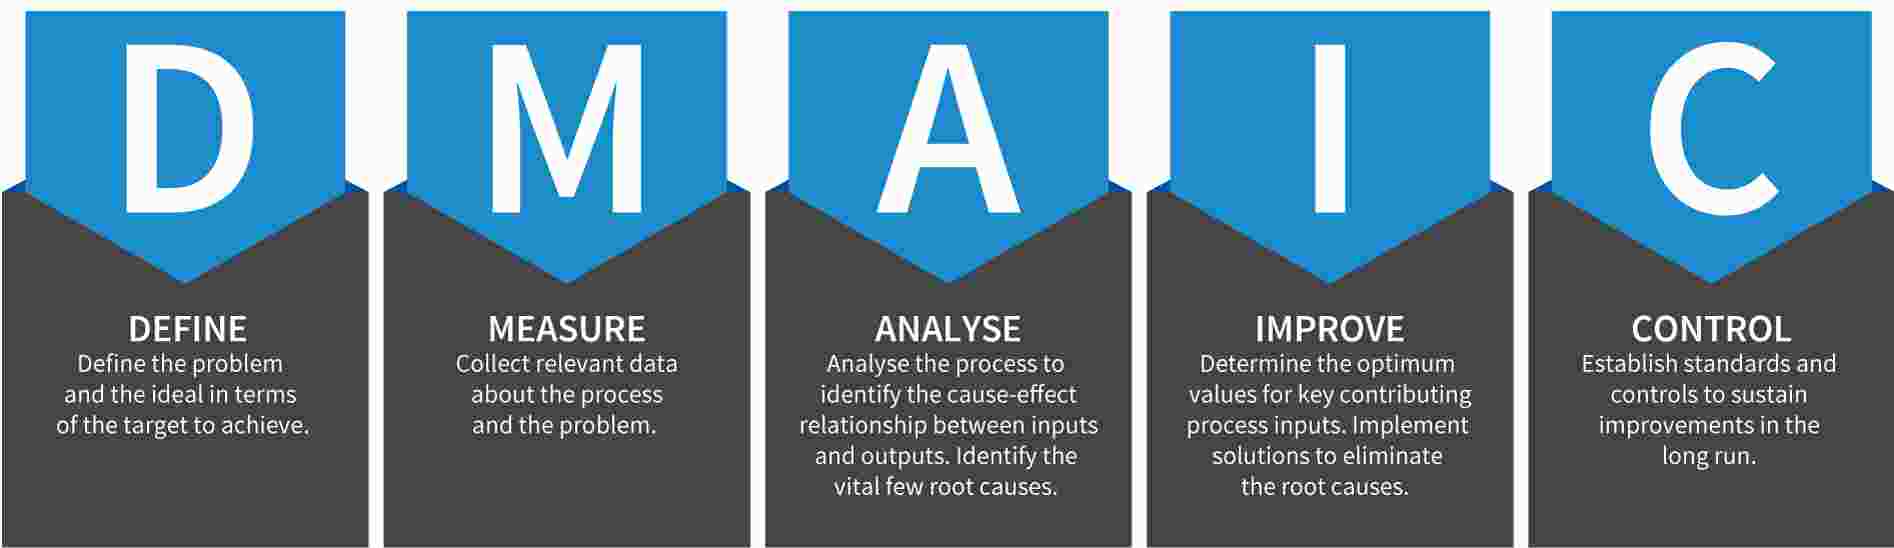
D-Define; M-Measure; A-Analyze; I-Improve; C-Control
Source : https://traccsolution.com
Define: It is the first phase in the DMAIC journey where the Project charter is signed off and VOC is collected for the project. Process mapping techniques are used in this phase to chart out the process at different levels.
Example- SIPOC,Macro map etc.
Measure: It is one of the lengthiest phases in DMAIC journey and has few important deliverables. Understanding of data types is the most important aspect since data collection is done in this phase. This data is used in the project which goes forward for different analysis. Another important activity performed in Measure phase is the Measurement System Analysis (MSA), which is used to find out the reliability of the data being used in process and project. After the process is over, the probable causes of error are then identified using different root cause
analysis tools and techniques along with graphical analysis.
Analyze: This phase is also called the heart of Six Sigma since statistical testing is performed here to validate the causes identified in Measure phase. Different Hypotheses tests are performed and vital root causes are shortlisted in this phase.
Improve: This phase is for identification of solution, prioritizing the solutions, implementing the action plans and validating the benefits achieved out of these solutions/action plans.
Control: Control phase is to show the sustenance of the benefits achieved in the project. Control charts and Control plan are two important components of this phase. Towards the end, a cost-benefit analysis is done to show the value achieved and the project is closed.
One of the most important deliverables of the Measure phase is to collect data which is used later on in the project in identifying probable root causes, performing statistical tests etc. Hence, for a six sigma team to understand the types of data and when and how to use them is always imperative.
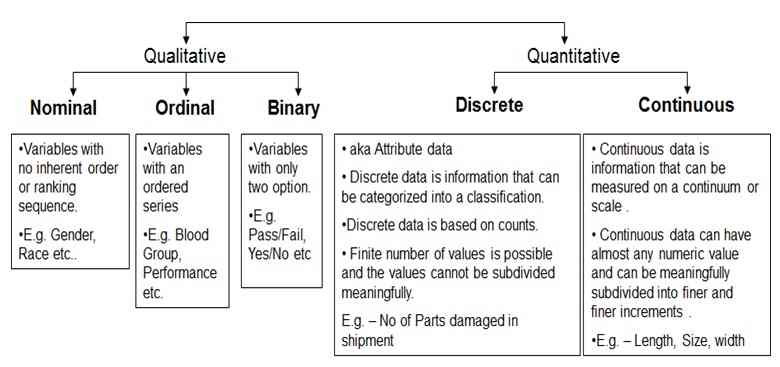
There are primarily two types of Data that we talk about in Six Sigma-
DISCRETE DATA:
Data that cannot be further broken down and if broken down will not make any sense. Data types that have a finite number of measurements and are based on counts. Examples:
- Number of people who pass a test
- Count of errors or number of errors on a bill
- Number of calls offered in a process
- Number of defects in a sample
- Number of days in a week
- Count of customers walked in a restaurant
Discrete data can further be of different types-
Source : https://stats.stackexchange.com
- Ordinal Data
The first type is discrete ordinal data. A set of data is said to be ordinal if they can be put it in an order. Note that ordinal data can be counted and set in order but it cannot be measured. For example, Data put in an order from 1 st to 5 th.
- Nominal Data
The second type is discrete nominal Data. This type of data is descriptive, and not numeric, with more than two categories, for example; names, phone numbers, colors, type of car, capital cities and states.
- Binary Data
The third type is discrete binary data. This is qualitative or categorical in nature and is made up of two classifications. For example, Yes/No, Pass/Fail, On/Off, Male/Female, Good/Bad etc.
Source : http://www.six-sigma-material.com/Data-Classification.html
CONTINUOUS DATA
Data that can be further broken down. Continuous Data can take on any value on a continuous scale such as temperature, distance, cycle time, profit etc. Examples:
- Time (Hours, Minutes and Seconds)
- Height (Feet, Inches, Fractions of an inch so on)
- Temperature (Degrees Celsius and Fahrenheit)
- Weight (Kg, Gram etc.)
- Money (Dollars, Yens, Euros, and fractions thereof)
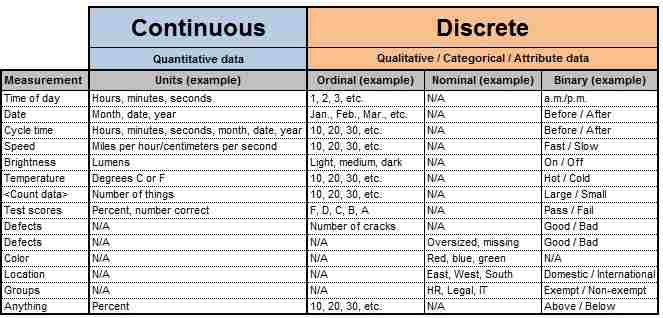
How can you distinguish data types in Six Sigma?
Think about the Unit of Measure, then ask yourself if “half of that thing” makes sense. If the answer is yes (means if that can be broken down), then the measure is “Continuous.” If the answer is No, then it is “Discrete”.
COMPARING DATA TYPES
| Continuous Data | Discrete Data |
|---|---|
| More Precise | Less Precise |
| Provides more information | Less informative |
| can remove estimations and rounding of measurements | Cannot remove estimations completely |
| To obtain continuous data is more time-consuming | Less-time consuming |
Data Collection Plan
A data collection plan (DCP) is a format which is used to capture different data points required for the project in one place. It acts as an important means of communication to all the stakeholders. The plan helps bring all the members in a project on the same page.
Source : https://asq.org/
Measurement: Measurement signifies the metrics i.e. the measurements that should be recorded.
Operational Definition: Defines how the metric/measurement is calculated and what kind of metric/measurement definition is used in the operations.
Type of Data: Whether the data used is continuous or discrete should always be mentioned. Based on this information, the different statistical tests or control charts would be selected in further phases of a project.
Sampling: The data that is collected should be used using a scientific method- sampling. Type of sampling methodology used in the collection of data needs to be stated.
Frequency: The data collection plan tells exactly at what frequency the data needs to be collected.
Who: In today’s world, the data to be collected is done by a machine or by humans. However, there are people who are responsible to run the software to collect the data and showcase in a manner which is acceptable to the Six Sigma Team. The “who” therefore refers to the responsible person who does this.
Data Collection Plan Sample
| Measure | Data Type | Operational Definition | Stratisfaction factors | Sampling | Frequency | Who and How |
|---|---|---|---|---|---|---|
| Average handle time | Minutes-continuous | Total talk time+ hold time+ after call work/No. of calls taken | By time of day | Simple random sampling | Everyday | Work force management team will put the data from the tool |
In Control phase of DMAIC, we need to select the appropriate Control chart to be used in the project. Selecting the right control chart also depends on what type of data needs to be plotted. There are different control charts for different data types that can be used.
Read more: DMAIC - A Six Sigma Process Improvement Methodology