
How to measure Process Capability and Process Performance?
Introduction
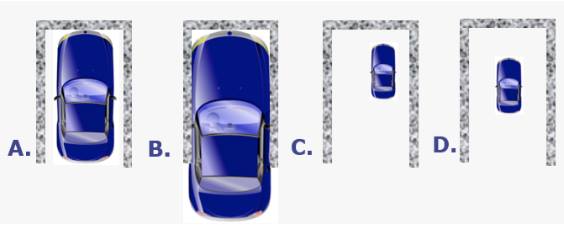
Source: https://www.semitracks.com/newsletters/october/2014-october-newsletter.php
The above example shows the capability of the garage, the example itself explains what is the process capability. If process spreads as Car B the garage capability will be low, however, if a process is narrowed like C or D we could see that the process is capable to perform as per customer's expectations.
The Process Capability is a measurement of how the process is performing with respect to the desired outcome. The capability is defined as the voice of the customer over the voice of the process.
Process Capability has two parts namely, the process and its capability, which essentially means how capable is the process of satisfying the customer or whether the process is capable enough. Talking about the process, it is often influenced by many other factors and noises.
Therefore, the process would not give the same outputs each time, it will get deviated from its target. Deviating from the target can put a question on the capability of the process; therefore, to check the process capability, we need to perform the process capability test.
What is Process Capability?
The process capability is the measurement of the capability of the process performed when there are some noise factors and process inputs impacting the process due to which the output of the process could not be in target line and might get deviated from the target.
Here the target means the process target given by the customer. Customers give the target with some specification limits i.e. USL (Upper Specification Limit) and LSL (Lower Specification Limit), these are the boundaries of the target which customers already take into consideration. But obviously, hitting the exact target is practically not possible, and therefore customers give the USL and LSL.
If all our data points lie between these given specification limits, we can say our process is capable, however, if data points are crossing the specification limits given by customers, it means the process is not capable enough to provide the data as per customers’ requirement.
For example, if a pizza needs to delivered to the customer in 30 minutes then crossing the 30 minutes time limit could be considered a failure or there can be a chance to deliver the pizza for free. Here we can see that we have only one specification limit which is the USL.
Hence, we can say that specification limits can be on both Upper and Lower side or only one side Upper or Lower.
Key Points to remember for Process Capability
While we discuss process capability, we must assure that data must be normal and in control. If data is not normal and in control, it is fruitless to check for the process capability.
- Process capability gives a long-term performance once it is under the statistical boundaries.
- It checks the ability of the process also the ability of the people, machines, measurement, and methods as well.
- Process Capability could have both side limits, in manufacturing industries, for any measurement, there would be upper and lower specification limits. In other industries, there might be a chance of only a single limit, either maximum limit or minimum limit. For example, the delivery of the product should have only the maximum limit, whereas passing an exam has a criterion of minimum 60%.
Read more: Top 5 Tools Used For Process Improvement
The Capability of Discrete/Attribute Data
The discrete data will either be defective for example pass or fail, no or go or; Binomial data 0 or 1.
On the other side, discrete data can have defects e.g. scratches and number of errors in one single unit of material or data. This is called the Poisson.
The capability of these data can be calculated from binomial or Poisson distributions using the Minitab or other software packages, data can also be converted into continuous form and then the normal method of process capability can be used.
Graphical representation quantifying the process capability
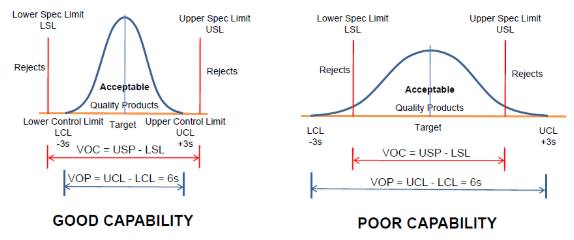
Source: http://blog.naver.com/PostView.nhn?blogId=020170&logNo=10141089343
In the above figure, we can see that when the process data has a wider spread, it reflects the poor capability, whereas a narrower variation spread shows a good capability. Since it is under the specification limits, there is more area for committing the errors, whereas, in the poor capability figure, we can see process variation exceeding the specification limits.
Also, in this figure, we can differentiate between VOC and VOP. VOC is given by the customer, whereas VOP is the processed voice, it comes inherently from the data and creates the Upper Control Limit and Lower Control Limit.
While VOC gives Upper Specification Limit and Lower Specification Limit, it can only be one-sided, however, control limits must have both sides.
You may also like to read: DMAIC – A Six Sigma Process Improvement Methodology
Measures of Process Capability (Indices)
Process Capability Formula (Cp, Cpk):
Cp and Cpk are used for the short-term process, or within 6 σ.
Cp= (USL-LSL)/6σ (within) and Cpk = min (Cpu, Cpl),
Cpu = (USL-Mean)/3σ (within)
Cpl= (Mean-Cpl)/3σ (within)
In the Cpk, k stands for off-target variation.
K= (Process Centre-Process Mean)/50%of USL-LSL and if we talk about process center;
Process center = (USL+LSL)/2, and the process mean is the average or mean of the process data points.
While we talk about σ within, it reflects the Rbar/d2 or Sbar/C4.
Rbar/d2 are used for data if we see the average of the ranges of the subgroups and when we have a subgroup size of less than 10; whereas, Sbar/C4 is used for the data points when we have subgroup size ≥ 10, where the D2 and C4 are the predefined control charts constants, as per the subgroup size we have taken. We get the constant value for D2 and C4 from statistical data.
Process Performance Indices Formula (Pp, Ppk)
Pp =(USL-LSL)/6σ (overall) and Ppk = min (Cpu, Cpl)/6 σ,
Ppu = (USL-Mean)/3σ (overall)
Ppl= (Mean-Cpl)/3σ (overall)
σ(overall) = Sqrt (∑(x-xbar)^2/(n-1)), here xbar refers to the process mean, individual data points refer by x, where n indicates sample size and their degree of freedom reflects as n-1.
The Pp and Ppk provide the overall process capability overview or long-term process capability. It shows the exact process capability at current.
Difference Between Cp and Cpk
Cp and Cpk both give the process capability, while Cp talks about the data spread and width of the data range, the Cpk talks about the data points near to mean.
Though both give the process capability Cpk gives a more precise process capability. Since it sees the data point with mean unlike Cp, which provides the data points between the USL and LSL.
There are chances that data points lie between the specification limits, but far from the target. Hence process will be more capable if the distance between the points and target less. Which we could see by the Cpk value.
Learn more: Continuous Process Improvement and its Growing Importance
Difference Between Cpk and Ppk:
Cpk talks only about the common cause variation or short-term process within the subgroups. The Ppk, on the other hand, calculates for all common cause and special cause, i.e. long-term processor so we can say overall process subgroups.
Cpk talks about the potential of the process capability, whereas Ppk provides the actual process capability status.
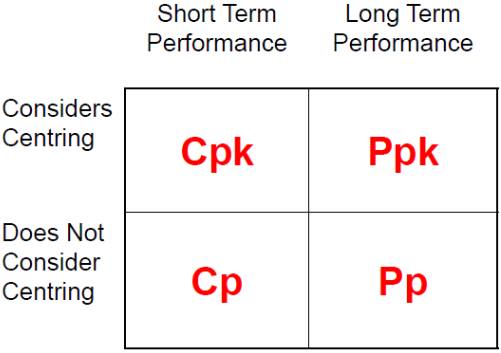
Difference between Cp, Cpk and Pp, PPk:
Source: https://m.blog.naver.com/PostView.nhn?blogId=papawolf8&logNo=221107552489
The above table gives the detailed information of the process capability. The Cp and Cpk talk only about short-term processes. It is only CCV, where Pp and Ppk talk about the long-term performance.
The Cpk and Ppk consider the centering and seeing the data points around the center. Where Pp and Cp indicate the spread of data points between the upper and lower specification limits.
Key Assumptions of Process Capability
Cp and Pp cannot be found for the Unilateral process when we have only one specification limit, as the formula itself says, they need both specification limits. The unilateral process can be measured by the Cpk and Ppk.
Cpk or Ppk consider better process capability measurement options since they consider the centering and data points check with their target.
Pp and Cp, on the other hand, provide the spread over the data points and do not consider the target, therefore the chances would be that although the data points lie between the specs limits we still cannot give the assurance for their shift from target mean.
Cpk value can be found if we know the Cp and can calculate the k value also i.e. Cpk = Cp(1-k), where K can be any value from 0 to 1.
I mean is centered and there is no shift in the mean, then Cp and Cpk value would be the same.
Cp and Pp will always be greater than Cpk and Ppk respectively.
Related reading: What is Capability Analysis?
What are the steps of Capability Analysis?
First of all, in Six Sigma, we must know what type of data we are dealing with since there are different methods of measuring the two data types: Discrete and Continuous; likewise measuring process capability depends upon the data types.
The below steps must be followed for Capability Analysis:
- Check the data type whether it is Continuous or Discrete.
- If it is discrete data then apply the Capability Analysis (Binomial).
- If it is continuous data then, check the process stability.
- Process Stability can be checked by the I-MR control chart.
- If the process is not stable, then we cannot calculate the process capability, we need to fix or adjust the data as stable.
- If it is stable, then we check the process normality.
- If the data is normal and stable, we can calculate the Capability for normal data.
- If the data is not normal, first need to make the data normal, if the data cannot be normalized then use the Box-Cox transformation.
- Once data is fixed to normal, calculate the process capability.
All the above can be done by using the Capability Sixpack.
The relation between Cp/PP with Sigma:
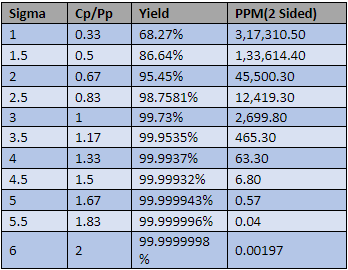
Here, we can see that Sigma is three times more than the Cp/Pp value. If we know the process capability we can also find the process sigma by multiplying it 3 times.
Process Capability for Non-Normal Data
To calculate the process capability, it is necessary to understand the process data shapes, whether it is normal or non-normal, if it is non-normal data we must see that process is in control or not if it is not in control; then it cannot be predicted for process capability.
If the process is out of control we must find the root cause and fix the issue before going for further testing.
For non-normal data, we must either transform the data into normal or try the special case calculation for non-normal data.
Explore: 7 Things You Must Know About Value Stream Mapping
Process Capability for Non-Normal Discrete Data
In discrete data, it is necessary that the data must be in numeric form. For example, The number of errors in a month, or a number of students present in a class; it should be in a Poisson distribution.
We then calculate the DPMO/PPM as per the metrics we choose like defect use DPMO and for defective PPM; also, we should use the binomial chart i.e., P chart or Poisson distribution by using u chart. To calculate the process capability for Discrete data the Sigma level (Z) is computed.
Conclusion
As we all know, any process would have the variance, due to the multiple outputs or there may be some noise in the process. If we have different inputs, then the outputs will not be the same or exactly hitting the target every time. For such scenarios, customers must give the space for acceptance of variations. Hence, we can say that every process has variations.
In case there is a variation, we then need to see, how much are we deviating from our target and how much are we within the customers’ defined limits.
The process capability is thus, defined as the ratio of the voice of the customer and voice of the process:
Cp = (USL-LSL)/6σ.
Long-term process capability cannot be the same as the short term.
We must always try to change the Non-Normal data to normal first and convert Discrete data to Continuous data in order to get the more accurate details.
What's Next? Book your slot for the upcoming batch!
Another interesting read: A Complete Guide to a Lean Six Sigma tool: SIPOC