Data Science Certifications

What is Data Science?
Does it seem too simple? Well, that's because it is! Many people believe that Data Science is hard, but that is not the case.

Quite often, the end goal is to inform decisions within organizations and societies. “Data” refers to the information that we can capture, observe, and communicate. For example, a sales receipt, signals sent by a sensor, or a product review are all considered as data points.
Organizations analyze these data points to develop an understanding gained through data insights. As a business, we may want to know “Which store might need the highest restocking next week?”. As a nuclear power plant, we may ask “Is the system operating within safe limits?”.
As a customer, I could wonder “Which is the best product according to the Internet?”. Using the characteristics of science, statistics, and probability, Data scientists generate testable hypotheses. The data results then serve as evidence to support or disprove hypothesized theories. The skills and tools that enable large scale data analysis is a core tenet of Data Science.
History of Data Science

Humans have systematically recorded and analyzed information since the very dawn of history. For instance, the Ishango Bone, discovered in 1960, is one of the earliest pieces of evidence of prehistoric data storage and analysis. Historians suggest that cave-dwelling humans marked notches into sticks or bones to keep track of trading activity, supplies, and even the lunar calendar cycles.
Fast forward to the modern era. Can you think of a successful business or government that does not analyze data? Since the 1970s scholars have worked on combining the science of data processing, statistics, and computing. The term “data science” can be traced back to Dr. William S. Cleveland in 2001. His action plan motivated universities to design a curriculum for the field.
In the paper, he called for knowledge-sharing between computer scientists and statisticians. He argued that computer scientists could use knowledge about how to approach data analysis.
Likewise, statisticians might find knowledge about computing environments to be helpful. Meanwhile, during the "dot-com" bubble of 1998-2000, prices of hard drives and computers crashed. Corporations and governments accumulated more data and computing resources than ever before. Advances in semiconductor technology-enabled manufacturers to meet the growing demand. This cycle created the era of “Big Data”. A term used to describe large and complex data sets incapable of analysis through regular database management tools.
The rise of the Internet during the late 90s and early 2000s is another contributing factor to the Big Data era. It allowed for rich multimedia data to propagate. Companies at the time tackled the problem of the best possible way to search across billions of available web pages.
They developed parallel computing-based data processing techniques to address it. These technologies serve as a foundation for data engineering tools available today. Technologies such as MapReduce and Hadoop allow for computations across Big Data in an efficient manner. It also allowed the theories and tools of data science to be accessible by a larger community.
Data Science Lifecycle
The field of data science has evolved to become useful in almost every field of profession. Think of your favorite sports team, your most trusted bank, or your most frequent fast-food chain. They might use a process like the data science lifecycle at some point to create a strategy. Otherwise, they might be at a disadvantage to a capable rival who does! You may wonder “Exactly what IS the data science lifecycle?”.
It is a way of approaching data and extracting insights from it, which informs your decisions. Think of it as an iterative process with the following stages - Understand, Obtain, Clean, Explore, Model, and Interpret.
-ImResizer.webp?width=492&height=327&name=4-3%20(1)-ImResizer.webp)
The Data Science Lifecycle
1. Understanding Objectives
-ImResizer.webp?width=233&height=233&name=5-3%20(1)-ImResizer.webp)
Understand the business objectives by asking relevant questions. At this stage, we may define a tangible end-goal for our analysis. We may want to measure a performance metric or determine the root cause of an event. We would be prescribing actions to the stakeholders based on these measurable criteria.
2. Obtaining Data

Obtain the data required for analysis. The type of data, its source, and its availability may vary depending on the domain of application. The data may be available for download or derived from another data source, or collected from scratch.
We can categorize data as structured if it comes in the format of tables (of rows and columns). Unstructured data may need some pre-processing to convert into the required formats. For example, web pages, URLs, images, and audio.
3. Cleaning the Data

Clean the data to a format that is understandable by machines. This step is crucial in ensuring that the data is relevant and that the results are valid. We fix the data inconsistencies and treat any missing values within the dataset.
We may use scripting languages like R and Python to clean and pre-process that data into a structured format. Tools such as OpenRefine or SAS Enterprise Miner provide implementations of common data cleaning methodologies.
4. Exploring the Data

Explore the data and generate hypotheses based on the visual analysis of the dataset. This involves obtaining summary statistics across different dimensions of data. Here, dimension refers to a column in a table.
If you are using Python, you may want to make use of packages such as Numpy, Matplotlib, Pandas or Scipy. For R, you may find ggplot2 or Dplyr to be useful. In this step, data scientists generate testable hypotheses about the problem that is being solved. This provides a guiding method for the next step.
5. Modeling the Data

Model the unknown target variable using the data available. A model allows its user to input the data and outputs a prediction or estimation of the unknown variable. The individual columns or dimensions of the data are also known as features (denoted as X). The unknown target variable (denoted as Y) is a quantity we estimate or the outcome we predict.
This could be the price of a share in the future, the demand for a product in a given week, or the decision to approve a loan. A data scientist also determines what effect each feature has on the output. This step is also known as feature engineering.
6. Understanding Feature Engineering

Understanding feature engineering with an example gives in-depth knowledge into the subject better. For example, how would you use the information about the customer's age and income when approving or rejecting a loan application? Building such models and hand crafting the features requires a lot of manual effort.
Moreover, such models cannot capture trends across large datasets. Recently, research in the field of machine learning (ML) and artificial intelligence (AI) has addressed this problem.
These systems are capable of automatically finding important features from the given data. Analysts use ML/AI to "learn" important features and build accurate models of the target variable. ML/AI models sometimes outperform humans at tasks such as Object, Face, and Voice Recognition. An ML/AI model built for one task may also be useful for another related task.
The disadvantages of ML/AI systems are that they need large datasets, computing resources, and time to train. Besides, the reason why they made a prediction or estimation may not be easy to determine (although that is changing). The difference between AI and Data Science lies in the fact that AI may be extremely effective in building models, but cannot yet govern the business direction of the larger investigation, or make general reasoning from diverse data (yet!).
7. Interpreting the Data
.webp?width=272&height=272&name=11-1-ImResizer%20(1).webp)
Interpret the results from the model to stakeholders through impactful storytelling. This step could be the most crucial aspect of the life cycle. We may deliver months of work to stakeholders within the organization that sponsors the study.
This involves not only presenting the results but also prescribing a plan of action. We communicate the most important observations, findings, insights, and recommended actions. This needs to be in a simple and visually impactful format. This requires a combination of ideas from communication, psychology, statistics, and art.
8. Implementing the Data Science Life Cycle

The data science lifecycle sounds simple enough. As we can expect, implementing this for a specific problem in a domain may not be straightforward. It may need a fair bit of business understanding, iterative experimentation, clever intuition, and persistence. Free capital markets do not ignore the edge that data science brings to their organization. The basic process followed by most organizations include:
-ImResizer%20(2).webp?width=242&height=303&name=13-a%20(1)-ImResizer%20(2).webp)
The output of a data science model might be subtle - for example, it may answer the question “Where should we place product X on the shelf in a superstore?”. Its impact may run into the range of hundreds of thousands of dollars. That explains why data scientists are among the highest-paid professionals! On the same note, nonprofits use data science for social good as well. Data science has informed marketing operations within NGOs.
They may develop personalized incentive models based on donor information. They may also track and streamline their activities using the data science lifecycle. Governments also better the lives of their citizens through data science systems. Predicting the crosswalk locations to enhance road safety is one such example. There are a variety of application domains, a perceived shortage of data scientists, and hence large incentives for diving into this field.
Data Science Jobs- the hottest jobs of the 21st century?
-ImResizer%20(2).webp?width=302&height=378&name=13-a%20(1)-ImResizer%20(2).webp)
Tech companies were the pioneers in demonstrating the edge that data-driven decision-making provides. For instance, Google and Facebook, have based their business model on monetizing data. They earn their revenues from advertisers on their platform. Their value lies in leveraging their unique data sources.
The ads are tailor-made to users on these platforms based on information available only to these companies. Amazon is another example of how data science is transforming businesses. They have designed protocols within their warehouses that allow detailed data collection.

Through insights gained by analyzing this data, they are able to streamline the supply chain to allow faster deliveries. They also drive sales through their recommendation system which is highly data-driven. Similarly, with Project Oxygen, Google has shown how they can improve HR policies based on data. They analyzed thousands of performance reviews and employee surveys using text mining. They were able to identify 8 manager traits that best predicted success.
This trend of embracing data science has carried over to other verticals such as finance. Banks, for example, have developed automatic fraud detection systems that protect customer accounts. They have also developed automated trading systems that analyze thousands of transactions per second to make the right decision. There are effective products available in the market which makes it easier to mine insights from raw data.
-ImResizer.webp?width=508&height=299&name=13-3%20(1)-ImResizer.webp)
Small-scale businesses have discovered that they can achieve growth by using even some of the simpler functions that these tools provide. There is a high demand for talent that can plan a solution to a business problem in a testable manner. The Big Data Market forecast is presented below:
-ImResizer.webp?width=703&height=276&name=14-a%20(1)-ImResizer.webp)
What do Data Scientists do?
Figuring out what Data Scientists do is very confusing. Unless you are already one, the answers might seem vague. So let’s try to break it down to understand the roles and responsibilities of a Data Scientist.
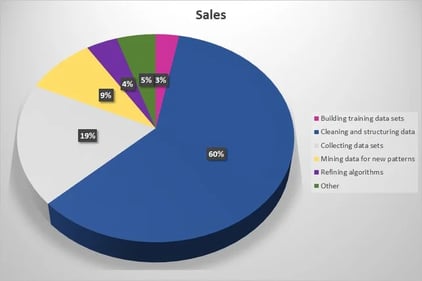 Data scientists gather, organize, and analyze large amounts of data to solve problems in business and other enterprises (e.g., nonprofit organizations, academic institutions, government). The job requires a strong knowledge of programming and software applications, data analysis, statistics, data visualization, and strategy. They are often required to have robust communication skills since they need to convey complex analysis to stakeholders who might not understand it. First, data scientists lay a solid foundation of structured and curated data to perform robust analytics as per their requirements. They then use online experiments, among other methods, to achieve sustainable growth. Data science is about infrastructure, testing, machine learning for decision-making, and data products in tech. Data scientists work with business stakeholders to understand their goals. They determine how the data can be structured to be used to achieve those goals by designing data modeling processes, creating algorithms, and predictive models to extract the data the business needs. This process helps them analyze the data and share insights with peers. While each project is different, the basic tasks are shown in the pie chart below, along with the percentage of overall time spent on each task:
Different Data Scientist Jobs Roles
The most common careers in this field include:
Data scientists: Design data models to create algorithms, predictive models, and strategies and perform the required analysis and deep dive.
Data analysts: Manipulate large data sets and use them to identify different trends and reach informative conclusions to take strategic and smart business decisions. Often called financial analysts, quality analysts, etc., based on the industry.
Data engineers: Clean and organize data from various sources and transfer it to data warehouses. Aggregate the data for various purposes.
Data architects: Design, strategize and manage an organization’s data architecture.
Business intelligence specialists: Identify trends/Deep dive in data sets to solve business problems.
What does it take to make a good Data Science Team?

A good data science team needs the technical expertise to acquire, clean, and analyze the appropriate data sources. They also need quantitative skills to measure and devise appropriate metrics. They should understand the business to identify patterns and insights from the data. Communication skills are essential in driving actions within organizations based on these insights. The supply of data scientists with these talents seems to be at a shortage. The Burtch Works study from 2018 suggested that the median salary for entry-level data scientists was as high as $95,000/year in the US!
We see data science driving success within industries such as Healthcare, Automaking, and Energy. As more devices connect through a network, the era of Internet-of-Things (IoT) is emerging. Networks of sensors will mean that more data will be available for collection and analysis. The reducing cost of computation and the need to analyze large data stores will allow data science combined with machine learning technology to drive further innovation in the field of automation.
How to become a Data Scientist?
-ImResizer.webp?width=449&height=300&name=16%20(1)-ImResizer.webp)
Now that we know ‘What does a Data Scientist do?’. Let’s move over to how to become one? Data scientists operate on the verge of strategy, statistics, and computer science. Due to the nature of the job, it helps to have training at an undergraduate level in a quantitative subject. These include mathematics/statistics, physics, economics, finance, or engineering. But, data analysis also requires an interdisciplinary perspective. Hence, it is common to find data scientists having a background from a variety of disciplines.
Domain expertise about a problem area, quantitative, and programming skills are equally important. A data scientist spends the majority of its time leveraging domain knowledge to build models. They are also responsible for generating visualizations and communicating the results. All the while, they make extensive use of computing resources. So, a potential data scientist should be comfortable with at least one common programming language.
This could be Python for Data Science, R for Data Science, Matlab, Java, or C/C++. Experience using any of the big-data processing frameworks such as Apache Spark or Amazon AWS is an advantage. Knowing how to use the tools involved in data modeling, visualization, and reporting, such as Tableau is also useful. You may have the opportunity to pick up these skills as part of your job. If not, you can still get this knowledge from the internet. Online courses organize a vast amount of information into a structured curriculum for Data Science courses that can set you up to explore this field further through bootcamps. To showcase your skills you can choose to work on problems sets from Kaggle.com. Prepare a solution using any of the frameworks mentioned above while applying your knowledge on data modeling. Publish your solutions on public code repositories such as GitHub. This can help recruiters evaluate your proficiency.
What are the different DS Courses?
-ImResizer.webp?width=470&height=302&name=17-1%20(1)-ImResizer.webp)
The amount of information available on the internet can be overwhelming. Organizing the information around a concept can help newcomers assimilate each topic. GreyCampus provides a list of courses designed to build a solid foundation in Data Science through a balance of theory and practice.
The Certificate Program in Data Science offers a series of six courses curated in collaboration with IBM as an IBM Data Science Professional Certificate. The first among the six courses, Data Science Basics, provides you with an introduction to statistics and programming. Next, you will learn how to perform large-scale manipulations on data in an efficient manner.
Data Science with Python and Data Science with R will familiarize you with the data structures and packages used in these languages. You will learn how to perform data collection, wrangling, and visualization. You will also gain an intuitive understanding of how and when to use concepts in statistics. This includes descriptive statistics, inferential statistics, and regression analysis.
Machine Learning - Data Science
Next, the Machine Learning course covers more advanced modeling methods. This includes feature engineering, supervised learning, unsupervised learning, and recommender systems. Large-scale data analysis requires using distributed computing frameworks to allow efficient computing.
Big Data - Machine Learning
The Big Data: Hadoop & Spark Training covers the HDFS data storage format and the MapReduce paradigm of computing. This will allow you to efficiently query large data stores and build data modeling pipelines that may span many machines.
Tableau - Data Science
Next, you will learn how to create rich visualizations and impactful storyboards using Tableau Desktop Finally, the two Capstone Projects will allow you to work on business cases and present a solution for the problem statements. You will apply all the skills you learned throughout the series to build end-to-end solutions. This can help you get started on building a portfolio of your data-driven investigations on public datasets. You can apply this to the data and problem statements available on Kaggle.com.
Insights into the different DS Career options!

Data scientists can influence many functional teams with an organization. This can include product, sales, marketing, human resources, and leadership teams. The ideal data scientist is comfortable analyzing large datasets to gain insights. The insights inform actions that drive positive business outcomes.
Data scientists are responsible for finding opportunities for product improvement and process optimization. They may need to leverage many levels of company data. They build models to test the effectiveness of different courses of action. They also communicate the prescribed actions to a wide range of stakeholders. It is important to present the result of an analysis with the right context.
Understanding The Various Data Science Purposes

Data science involves a variety of tools used to build and test models, create/use algorithms, and create/run simulations. The goal is to use predictive modelling to optimize a performance metric. For example, take the case of improving customer experiences by offering personalized incentives. Say a large retailer has a problem where their customers are likely to switch to a competitor if they offer a better price. How would you devise a retention program? Reward programs involve a balancing act between the value of customers retained and the cost of the rewards. The analysts may choose to segment the customers based spending pattern.
What data would be available to a retailer that can help them distinguish between a loyal customer and casual shopper? Who would you provide discounts to a frequent shopper who spends $30 a visit or an infrequent shopper who spends $100 a visit? Can you decide what the customer might want a discount on based on their historical purchases? Many such questions arise within a variety of business contexts. It is up to the data scientists to figure out what questions need answering and where they can get the data to answer these questions.
Next, they must decide how to go about analyzing it and what insights are relevant to the problem. Finally, they should provide action items to their stakeholders that aim to improve some performance metric. Revenue expansion through product recommendations and ad targeting are examples of how companies leverage large corporate datasets to drive growth.
The A/B Testing Framework

Data scientists often develop an A/B testing framework to test model quality or policy effectiveness. They must coordinate with different functional teams to install models and track outcomes. They also develop processes and tools to track data quality and model performance. In this field of work, there is a strong emphasis on problem-solving and product development skills. There is an increasing trend in demand for data scientists with knowledge of machine learning techniques. The most frequently discussed topics being clustering, decision trees, and deep neural networks.
Knowledge of concepts from statistics has been favourable. This involves properties of distributions, statistical tests and their proper usage and experience. They may also need to configure third-party applications used to generate and communicate insights. This can include business intelligence platforms such as Google Analytics, Coremetrics, Adwords, and Facebook Insights. It also includes visualization tools such as Tableau, D3, and ggplot. Roles such as Data Analyst, Quantitative Analyst, and Decision Scientist and are typically filled by individuals from a variety of backgrounds having a firm grasp of these skills.
Understand the Data Science Pipeline

Data science pipelines generally involve data warehouses and cloud computing infrastructures. Data engineering is the aspect of designing, configuring, and maintaining this infrastructure. The data engineer role emphasizes expertise in computer science more than statistics. Knowledge of many programming languages such as C, C++, and Java is a prerequisite.
Experience with the UNIX environment and the command line to carry out system administrative actions is a bonus. Data engineers are comfortable with relational and non-relational databases. Their knowledge usually goes beyond data manipulation using SQL, Hive, or NoSQL. They are also familiar with the data definition and transaction control operations. This helps them create data schema and design the transaction management within databases.
Data science teams use cloud infrastructures to get computing resources. This saves the cost of buying physical computers that take up space and are cumbersome to maintain. Hence, data engineers must be able to decide on the choice of the cloud services that are most suitable and also configure and maintain it.
Cloud Services & Data Science

Cloud services and Data Science go hand in hand. Some examples are Amazon Redshift, S3, and DigitalOcean. They may also need to configure a distributed computing infrastructure since all the data may not fit into one machine. This requires advanced knowledge of MapReduce, Hadoop (HDFS), Spark, Lambda and Kappa architectures.
If the hacker-mindset inspires you and you are comfortable with picking up new technologies on the way, data science engineering may be an avenue worth exploring. It usually helps to have a background in electronics/electrical engineering, computer science, information technology, or telecommunications. If not, previous experience as a software developer usually adds value to this role.
Data Science & Organizations

Organizations now take a more streamlined approach to data science. Companies specializing in providing Data Science as-a-service (DSaaS) or AI as-a-service (AIaaS) are cropping up in the market. Yet, some organizations are choosing to develop their data science pipelines in-house. In a competitive market, a strong research program informing many pipelines proves to be a marked advantage.
Research teams analyze data engineering as well as predictive modeling aspects of data science. Their role involves coming up with novel data architectures and algorithms that aim to improve performance. They also work towards creating unique and rich visualizations tailored to the specific needs of the project.
Research teams are quite small when compared to the data science teams that they inform. They maintain a balance between scientists and developers. This role is usually composed of individuals with advanced degrees (Ph.D. or Master’s) in a quantitative background with experience in publishing research articles in leading conferences and journals.
How can I become a Data Scientist?
-ImResizer.webp?width=496&height=323&name=24%20(1)-ImResizer.webp)
Learning any technical topic is a task that requires consistent effort from the ground-up. Before delving into statistics and computer science, we need to have an aptitude for high school-level math. Especially in topics such as linear algebra and probability. Mathematical analysis is a necessary tool to be able to analyze the results of applying data processing algorithms. Gaining an intuition about ideas such as the central limit theorem, populations, and samples, and sampling distributions go a long way in interpreting data.
These ideas allow data scientists to build robust data collection processes. Misspecifying them could influence or undermine the results of the analysis. Data scientists must be able to reason about these topics to arrive at sound conclusions from the data. One of the few things that separate a data scientist from someone just building models is the ability to think carefully about things like error analysis, causal inference, and experimental design. Simultaneously, analyzing modern data sets requires computer programming.
Languages like Python and R allow you to build complex statistical models with a few lines of code. A range of libraries within these languages provide a computationally efficient implementation of algorithms. This provides a framework for building an effective data analysis method. You can find loads of publicly available material on the internet (linked below). You can go through them at your own pace and explore further as you encounter unknown topics. This works for many people who can rapidly assimilate complex topics.
Some of us may find that a structured timeline, along with an instructor, as part of a course is beneficial to the learning process. Although the concepts instructors teach haven’t changed a lot since the 90s, instructors are usually experienced in the field. They can provide valuable guidance about the current trends in the market. Getting personal feedback on coursework allows one to identify their strengths and the roles within data science that suit them.