
PERT and CPM : How are they different?
A quick introduction
Project Management has scientific ways of planning, implementing, monitoring & controlling. It considers various parameters of a project. These include money, material, manpower, time, and other resources. It includes Scope, Time & Cost.
We have network planning methods for this. These are PERT and CPM. PERT project management and CPM are two famous managerial techniques. PERT is an abbreviation of the Program Evaluation and Review Technique. CPM is an abbreviation of the Critical Path Method.
History of PERT and CPM
PERT was developed by the US Navy for the planning and control of the Polaris missile program. PERT was developed essentially to simplify the planning and scheduling of large and complex projects. It was developed for the U.S, Navy Special Projects Office. This happened in 1957 to support the U.S. Navy's Polaris nuclear submarine project. Emphasis was on completing the program as soon as possible. Later, this found applications across industries. It was used for the 1968 Winter Olympics in Grenoble. They applied PERT from 1965 until the opening of the 1968 Games. This project model was the first of its kind, a revival of scientific management, founded by Frederick Taylor and later refined by Henry Ford. DuPont's critical path method was invented at roughly the same time as PERT.
CPM was developed by DuPont to solve project scheduling problems. Emphasis was on the trade-off between the cost of the project and its overall completion time
Managing a project with these generally involves four steps:
- Planning
- Scheduling (Diagramming the network)
- Allocation of resources
- Controlling & Monitoring the Project Progress
What is PERT?
Program Evaluation and review technique (PERT) is a technique for estimating. It applies a weighted average of optimistic, pessimistic, and most likely estimates when there is uncertainty with the individual task/activity estimates. So, PERT is a method to evaluate and estimate the time required to complete a task. This is like a Three-Point estimate but here we give more weightage to the most likely estimate. The accuracy of single-point task duration estimates may be improved by considering estimation uncertainty and risk. This concept originated with the program evaluation and review technique (PERT). PERT uses three estimates to define an approximate range for a task’s duration:
Most likely estimate (M): This estimate is based on the duration of the task, given the resources likely to be assigned, their productivity, realistic expectations of availability for the activity, dependencies on other participants, and interruptions.
Optimistic (O): The task duration based on analysis of the best-case scenario for the task. This will tell the minimum time the task may take.
Pessimistic (P): The task duration based on analysis of the worst-case scenario for the task. This will tell the maximum time a task can potentially take.
Now let us see how we do estimates using three-point (Triangular Distribution) and PERT.
Let “E” be the estimated time taken for the task after calculation.
The formulas are:
• Three-point estimate / Triangular Distribution: E = (O + M + P) / 3
• PERT: E = (O + 4M + P) / 6
What is CPM?
Let us have look and understand what is the critical path method? Critical Path Method (CPM) is one of the Tools & Techniques of Project Time Management. It is used to develop a schedule. Schedule network analysis is a technique that generates the project schedule. It uses analytical techniques. Example: Critical path method, critical chain method, what-if analysis, and resource optimization. These techniques calculate the early and late, start and finish dates, for the remaining portions of project tasks.
Some network paths may have points of path convergence or divergence. These can be seen and used in schedule compression analysis or other analyses.
The critical path method is used to estimate the minimum project duration. This will help determine the amount of scheduling flexibility available on network paths. It calculates the early start, early finish, late start, and late finish dates for all tasks. These do not consider any resource limitations by performing a forward and backward pass analysis through the schedule network, as shown in Figure. We would be using the term task and activity interchangeably.
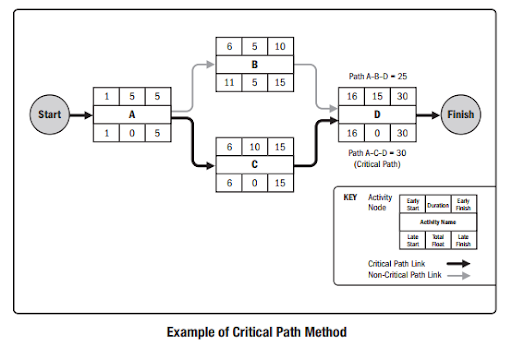
In this example the longest path includes tasks A, C, and D, and, therefore, the sequence of A-C-D is the critical path. The critical path is the sequence of activities that represents the longest path through a project. This determines the shortest possible project duration. The resulting early and late start and finish dates are not necessarily the project schedule. They show the time periods within which the task could be executed. They use the parameters entered in the schedule model for activity duration, logical relationships, leads, lags, and other known constraints. The critical path method is used to determine the amount of scheduling flexibility on the network paths within the schedule model.
On any network path, the schedule flexibility is measured by the amount of time that a schedule activity can be delayed or extended from its early start date without delaying the project finish date or violating a schedule constraint. This is termed as “total float.” A CPM critical path is normally characterized by zero total floats on the critical path. Critical paths may have positive, zero, or negative total float depending on constraints applied. Any activity on the critical path is called a critical path activity. Positive total float is caused when the backward pass is calculated from a schedule constraint that is later than the early finish date that has been calculated during forward pass calculation. Negative total float is caused when a constraint on the late dates is violated by duration and logic. Schedule networks may have multiple near-critical paths. Many software packages allow the user to define the parameters used to determine the critical path(s).
Adjustments to task duration may be required. For example, if more resources or less scope can be arranged, logical relationships (if the relationships were discretionary, to begin with), leads and lags, or other schedule constraints may be necessary to produce network paths with a zero or positive total float. Once the total float for a network path has been calculated, then the free float—the amount of time that a schedule activity can be delayed without delaying the early start date of any successor or violating a schedule constraint—can also be determined. For example, the free float for Activity B, in Figure, is 5 days
You may also like: Planned Value (PV), Earned Value (EV) & Actual Cost (AC) in Project Cost Management
Framework for PERT and CPM:
- Define the project
- Project should have a single start and finish task
- Develop relationships among the tasks
- Draw the "network" connecting all the tasks
- Assign time and/or cost estimates to each task
- Compute the critical path
- Use the network to help plan, schedule, monitor and control the project
Basic terms in a network:
Task / Activity:
- PERT activity: The actual performance of a task which consumes time and requires resources. It can be representing the time, effort, and resources required to move from one event to another. A PERT activity cannot be performed until the predecessor event has occurred or completed.
- PERT sub-activity: A PERT activity can be further decomposed into a set of sub-activities. For example, activity P1 can be decomposed into P1.1, P1.2, and P1.3. Sub-activities have all the properties of activities; in particular, a sub-activity has predecessor or successor events just like an activity. A sub-activity can be decomposed again into finer-grained sub-activities.
Event:
- PERT event: It is a point that marks the start or completion of one or more tasks. It consumes no time and uses no resources. When it marks the completion of one or more tasks, it is not "reached" (does not occur) until all the tasks leading to that event have been completed.
- Predecessor event: This is an event that immediately precedes some other event without any other events intervening. An event can have multiple predecessor events and can be the predecessor of multiple events.
- Successor event: This is an event that immediately follows some other event without any other intervening events. An event can have multiple successor events and can be the successor of multiple events.
Management tools:
PERT supplies many tools for management with the determination of concepts. Let us have a look at a few
- Float or slack: Is a measure of the excess time and resources available to complete a task. It is the amount of time that a project task can be delayed without causing a delay in any subsequent tasks (free float) or the whole project (total float). Positive slack would indicate ahead of schedule; negative slack would indicate behind schedule, and zero slack would indicate on schedule.
- Critical path: The longest possible continuous pathway taken from the initial event to the terminal event. It determines the total calendar time required for the project; and, therefore, any time delays along the critical path will delay the reaching of the terminal event by at least the same amount.
- Critical Activity: An activity on a critical path is a critical activity. This has total float equal to zero. There could be activities with zero float buy that may not necessarily be on the critical path since its path may not be the longest.
- Lead Time: The time by which a predecessor event must be completed in order to allow enough time for the activities that must elapse before a specific PERT event reaches completion.
- Lag Time: The earliest time by which a successor event can follow a specific PERT event.
- Fast Tracking: Here one would be performing more critical activities in parallel
- Crashing critical path: Shortening duration of critical activities.
PERT VS CPM
_11zon.png)
Now let us look at some advantages and disadvantages of both PERT and CPM
Advantages of PERT
- Planning for Large Project: It is used in scheduling large project by the project manager
- PERT chart explicitly defines and makes visible dependencies (precedence relationships) between the work breakdown structure (WBS) elements.
- PERT facilitates the identification of early start, late start, and slack for each task.
- Optimistic and Pessimistic times considered in the calculation. More weightage is given to most-likely time. Helps in better estimation
- PERT provides for potentially reduced project duration due to a better understanding of dependencies leading to improved overlapping of activities and tasks where feasible.
- A large amount of project data can be organized and presented in a diagram for use in decision making.
- PERT can provide a probability of completing before a given time.
- Visibility of Critical Path: It is used to show the critical path in a clear way. The critical path is of those paths where activities cannot be paused or delayed.
- Coordination Ability: This helps in improving the communication within different departments of the company.
Disadvantages of PERT
- There can be potentially hundreds or thousands of tasks and individual dependent relationships.
- PERT is not easily scalable for smaller projects.
- The network charts tend to be large and unwieldy, requiring several pages to print and requiring specially sized paper.
- Time Focused Method: PERT is a time-bound method, so finishing projects or activities on time is of high importance. If it does not happen than a problem can arise
- Subjective Analysis: Here, the project activities are recognized according to the available data. However, it is difficult in PERT projects as it is applicable for the only new projects which are not repetitive in nature, therefore, the collection of information is subjective in nature.
- Prediction Inaccuracy: PERT does not have any past records for a framework of a project, so prediction comes into play. The project will have a negative impact if the prediction is not accurate.
- Expensive: Too expensive in terms of time consumed, research, prediction, and resources utilized.
Advantages of CPM
- Provides an outline for long term coordination and planning of a project.
- Recognizes critical activities
- Easy to plan, schedule, and control project
- It improves productivity
- Manages the resource needed
Disadvantages of CPM
- People who are not aware of this method may find it difficult to understand
- Software used can be expensive
- At times it may take a long time to structure CPM
- CPM may not be able to form or control the schedule of a person allocated to the project
- Allocation of resources cannot be monitored properly
FAQs
1. What is PERT and CPM?
Program or Project Management and Review Technique (PERT) is apt for those projects where the time required to accomplish different activities is not known. CPM or Critical Path Method is appropriate for the projects which are reappearing (recurring) in nature.
2. What is a CPM used for?
CPM or Critical Path Method is used to assist the project manager in scheduling the activities. It presumes that the activity time period is known with certainty.
3. When to use PERT and CPM?
PERT is stipulated according to events whilst CPM is ranged towards activities. A deterministic model is used in CPM. While PERT uses a probabilistic model. PERT is generally used in Research and development projects. CPM is generally used in a Construction project, Projects of repeatable nature like residential construction, rollouts, etc.
4. How PERT is Calculated?
PERT is an estimating technique that uses a weighted average of 3 numbers to come up with a final estimate. The following PERT estimate is computed as (O + 4M + P)/6. This is known as “weighted average”.
Conclusion
Both PERT and CPM are managerial techniques that aim at achieving companies' goals, but in the case of PERT, uncertainty component is accepted and states as a part of the system. These can be used in combination with projects too.