Essential Lean Six Sigma Tools To Use With The DMAIC Approach
An organization requires good information to operate. It also must have the processes to meet these requirements. Organizations look for ways to improve the service they offer to their customers. It is their service that sets them apart from their competitors. The cost of quality (CoQ) is usually 25% of their sales, but could easily be as high as 40 to 50%. What happens when quality is compromised?
So, why is quality so important? Why do successful organizations put so much emphasis on quality? One way to answer this question is to consider the costs incurred by an organization when quality suffers. Here's a quick list of a few:
- Warranty costs - more goods returned for exchange
- Production rework - an overhead in the usage of production usage,
- Wastage - products components that cannot be reused in some manner
- Re-inspection - to assess the scope and scale of defects
We must also look at intangible costs that may arise such as lost customer loyalty. You may also note an increase in sales cycle times and loss of revenue. Late deliveries and poor reviews from critical industries you serve may show up.
What approach should be taken to maintain a consistent quality standard?
One of the leading approaches in use today is Lean Six Sigma. Lean Six Sigma is a quality management process that uses a scientific method and a wide array of tools and techniques. Some Lean Six Sigma tools are more common than others. They all help to increase the quality of a product or service delivered.
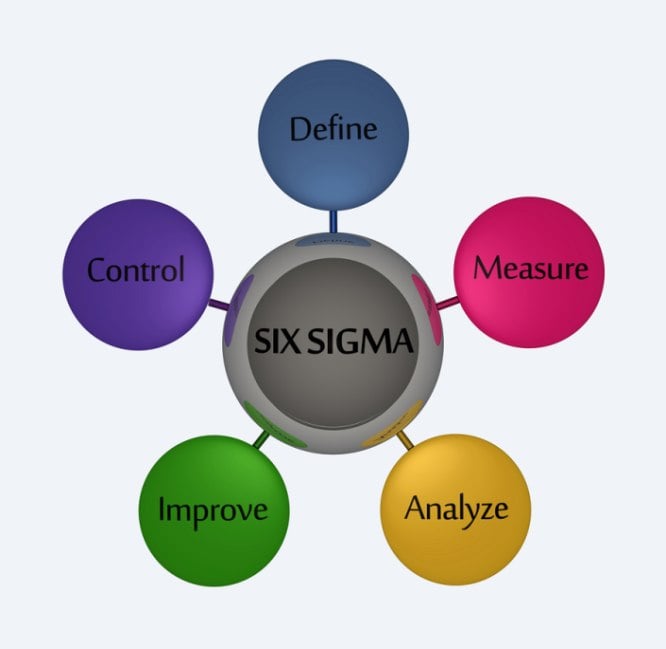
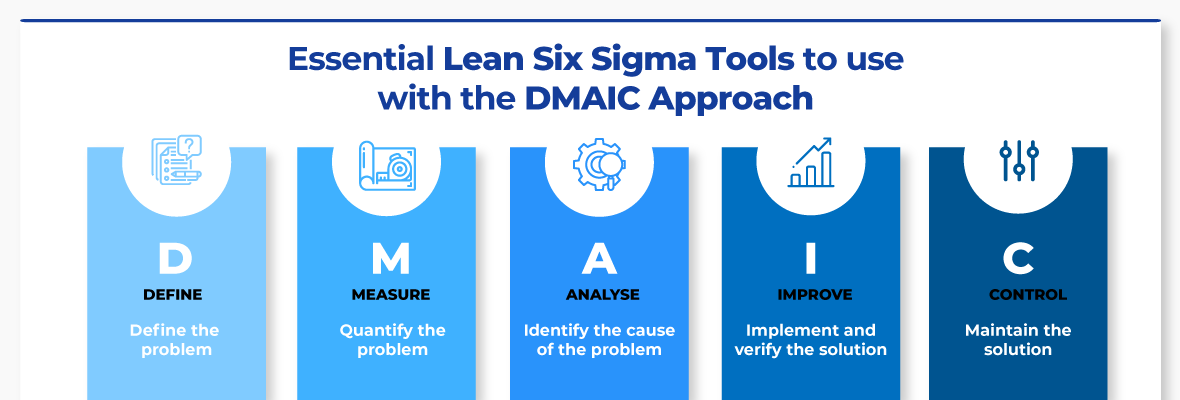
Lean Six Sigma is a five-phase process known as DMAIC — Define, Measure, Analyze, Improve and Control. The DMAIC phases and tools are for improving an existing process. Another process, DMADV, creates a new process, with the focus on customers throughout. The purpose of this article is on the types of tools and the different phases in DMAIC that you might use.
Phase # 1: Define
The desired output of this phase is to establish a clear list of things that will be improved upon. You will determine how to measure improvement. Create a high-level process map as well as a list of what is important to customers (called Critical to Quality). Here are a few guidelines to meet the objectives of this phase.
- Select a problem within an existing process. Pay particular attention to any glaring problems. Mine customer-facing personnel for suggestions - go to Gemba. If this is the first you're hearing of this incredible tool, and want to know how to do it, check out this awesome article right now! You should also look through customer complaints.
- Think “Meaningful Impact BUT Manageable in Scope” when choosing a project. Select the least elaborate and complex process that can make the most impact on the clients. Remember that you are striving for measurable improvement.
- Do a high-level Value Added/Non-Value Added analysis. Look for the potential to reduce process time or defects.
And now, here's a list of useful tools you might use in the Define Phase includes:
- Failure Modes and Effects Analysis: This tool identifies all the ways a process might fail. It then determines the impact(s) of each failure on other activities
- Suppliers/Inputs/Process/Outputs/Customers diagram: This tool will lay out the five key elements of any given process. It is critical to show who performs what tasks on what “materials” in the process
- Value Stream Analysis: A VSA compiles the activities necessary to produce and deliver a product or service. It will separate activities that contribute to value from activities that create waste. It identifies potential opportunities for improvement. To know more about Value Streams, take a look at this excellent article.
- High-Level Process Map: This tool will depict the process you focus on. It denotes all the steps, the sub-processes, activities, and results in the process. It shows the workflows and results and allows for a complete understanding of the process end-to-end.
- Voice of the Customer: This is my personal favorite. It is a technique for gathering systematic information on the customer's "needs and wants". It employs surveys and interviews for purposes of validation. It helps to ensure that you include customer needs and requirements in any activity. It provides a project team with a “to be” idea based upon the needs of clients. Clients should be selected from a complete range of customers. Note that this tool requires a data cleaning method for analyzing customer feedback.
Lean Six Sigma Project can often move back and forth between the Measure and Analyze phase. That is acceptable. This may be because the team will test a hypothesis in an iterative way. In the Measure Phase, use input gathered in VOC interviews to establish Performance Standards. Performance Standards translate the customer needs into quantified requirements for a process.
Phase # 2: Measure
This stage is vital in setting up an optimized process map. I employ a 5-step approach for this phase:-
- Develop a sampling strategy.
- Confirm the measurement system.
- Establish a baseline by collecting data on defects and possible causes.
- Are there any discernible patterns in the data? Do a close analysis to be certain.
- Determine process capability and create a more detailed process map.
Now, let us take a look at some tools to use in this phase:
- Detailed Map of the Current Process and a Situation Assessment. This helps to define the metrics we will gather and measure. For each stage of the process, the map delineates the activities conducted. It also shows the intended output, result or effect of the steps.
- Data Collection Plan and Data Table - A data collection plan provides a written strategy for collecting data you will use. The plan creates a clear strategy to collect reliable data. This plan gives all team members a reference for clear communication. It outlines the purpose and methods for data collection and links it to project goals. You will use this step to analyze the current measurement system (if any). This will help to determine its accuracy.
- To complement your Data Table, consider a Trend Chart. Trend Charts, also run charts, can show trends in data over a period of time. Many processes can vary due to different locations or different shifts. Single point measurements can be misleading. Trend Charts can show a "dip" or "spike" you may need to study. When you display process data over time, you understand the real performance versus a target.
- Process Capability is a tool I like to use in my analysis of an existing process. Process Capability is a test to measure if a process will meet customer requirements. Will it meet or exceed what customers expect from the process? Using throughput is one way to determine existing capability. If you are gathering large amounts of data, a histogram can display it in a useful visual summary.
- Another useful chart is the Pareto Chart. This chart can display an uneven distribution of defects. Think of the 80-20 rule. "20% of the clients cause 80% of the problems". Many defects can follow a similar type of pattern. A few steps in a process can account for a large percentage of defects. This will show how frequently a defect occurs. It helps rank steps and allows you to go after "easy pickings".
Phase # 3: Analyze
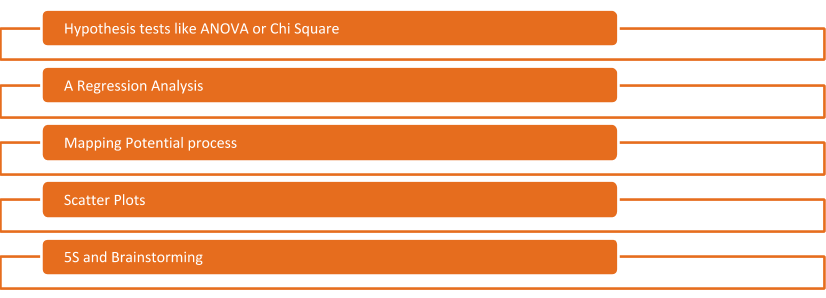
The third phase in Lean Six Sigma DMAIC is the Analyze phase. The tools for the Analyze phase make sense of the data collected during the Measure phase. The team uses the data to confirm a source of waste such as delays or quality defects. One challenge to be aware of is sticking to the data. The experiences of members can point in a specific direction for root causes. The aim of this phase is to note any patterns for the Improve phase. Now let us take a look at the tools.
- Fish-bone or Cause and Effect Diagram. This provides a visual display of all possible causes of a specific problem. Use it in the context of a group. It can expand discussion for all possible causes, to cover all the bases. It allows a team to do a better job of identifying correct causes, rather than what may appear to be “most obvious”.
- A 5-Why analysis method couples well with a Cause and Effect Diagram. You use it to move past symptoms you detect and understand the true root cause of waste. The 5-Why analysis is more than an iterative process or a simple question asking activity. The purpose is to get the right people discussing any possible root causes of a given defect in a process. Many times teams will stop once a reason for a defect appears to them. The problem's root cause can still hide below this initial layer.
- I like to use a Cost of Poor Quality Calculation on Marketing and Sales LSS projects. Cost of Poor Quality Calculation will quantify money lost due to waste. It is important because it can provide insight into potential value when you make changes.
Phase # 4: Improve
This is the phase where improvement strategies are put into place. You characterize and examine the variables you've identified. In developing a solution, you design and pilot this solution to test it. You test this solution as a hypothesis and confirm if it works before a large scale roll-out. The roll-out includes training, support, technology changes, and the process/documentation changes.
The tools in the Improvement phase are quite varied. You match the tool to the problem you face. Depending on the project you will look at a tool based on many factors. These factors might be complexity, data availability or business impact. Sometimes, an acceptable solution can come from a tool in an earlier phase. Other times you need a more complex tool. An entire article can be a dedication to going through the list. Here are some common tools for this phase.
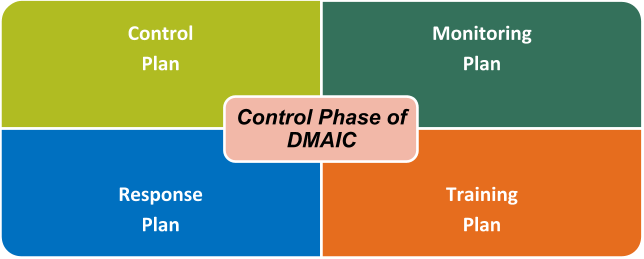
Phase # 5: Control
The Control Phase is the last phase of DMAIC but is most vital. Unless you add documentation to a process it will degrade over time and lose any gains from the project. The outcome you look for is to make sure the new process stays in control after you implement the new solution. I detail several of these tools below in a previous article about business requirements documents, found here. Below is a list of some plans that need to be incorporated as part of the Control Phase.
Finally, when you complete a DMAIC project, here are a few questions you want answers to.
- Did the process improvement meet the requirements of the customer?
- Did the solution result in any benefits that are unexpected or in addition to goals set out in the beginning?
- Can you leverage this solution to any other projects in your operation?
- Is there buy-in to keep the intended change or solution in place?
Become a Quality expert | Get trained by industry experts