
Deploying FMEA for the first time in your organization
In your organization, you may have experienced a few failures with a lot of expenditure. With the discovery of new processes daily, detection of failure is as important as ever. These processes often promise increased efficiency through reduced headcount. And also, a streamlining of workflow in operation at your workplace.
This occurs in cases such as:
- A new system or process
- A new software solution
- Equipment in the manufacturing space
- Robotic systems
What happens when these items fail? Implementing FMEA will help in identifying the seriousness and possibilities of any failures. These analyses are widely used in process engineering, quality, and continuous improvement. They have also made their way to IT in automation applications. They are designed to give engineers, in partnership with Subject Matter Experts, the opportunity to produce a qualitative or quantitative measure of how a single mode of failure can affect a system. What is the effect of the failure? How impactful is it? And which potential failure modes should the team act on mitigating first.
When to Perform Failure Mode and Effects Analysis (FMEA)?
The first question asked before a continuous development journey is when FMEA is necessary. An FMEA is performed for a new product or service to test defects, opportunities, and risks to the business related to that specific item. FMEA is also deployed to attempt to hit a particular quality or productivity KPI. This is where an FMEA can be very effective. It is also an effective method for providing a cultural tool for continuous improvement in your department or team.
However, one of the critical aspect of a successful FMEA implementation, before analysis is to include process owners from other departments. That is, including the owners that have a stake in the success and reliability of the system of parts being evaluated. It can be both upstream and downstream.
But it is essential to factor the thoughts and input from these members during the analysis. Additionally, it is common to perform an FMEA frequently throughout the process lifetime. It is essential to monitor and baseline based on changes in the organization over time. It is especially important if the process or service has a high risk or severity to the business if it fails.

Source: Freepik.com
At the onset of the FMEA, identify the item or function in question and what its intended purpose is. For a high-level example, a polishing wheel’s role would be to provide friction with buffing to an object to polish out imperfections to its’ surface. Then, identify potential Failure Modes for the item or function.
A Failure Mode is when the proposed function and associated requirements are not met or fulfilled by the item or operation. It may be due to the inability to deliver a function in the specified limits, or poor execution, irregular performance, or operating an inadvertent function.
Example of failure modes can be poor polishing due to a low or dead battery, poorly lubricated machine parts to turn the wheel, or a worn-out wheel itself. With the cause defined, you are now able to assess its effect and assign a Severity ranking to the affected failure mode – the first measure of the Risk Priority Number (RPN).
Risk Priority Number (RPN)
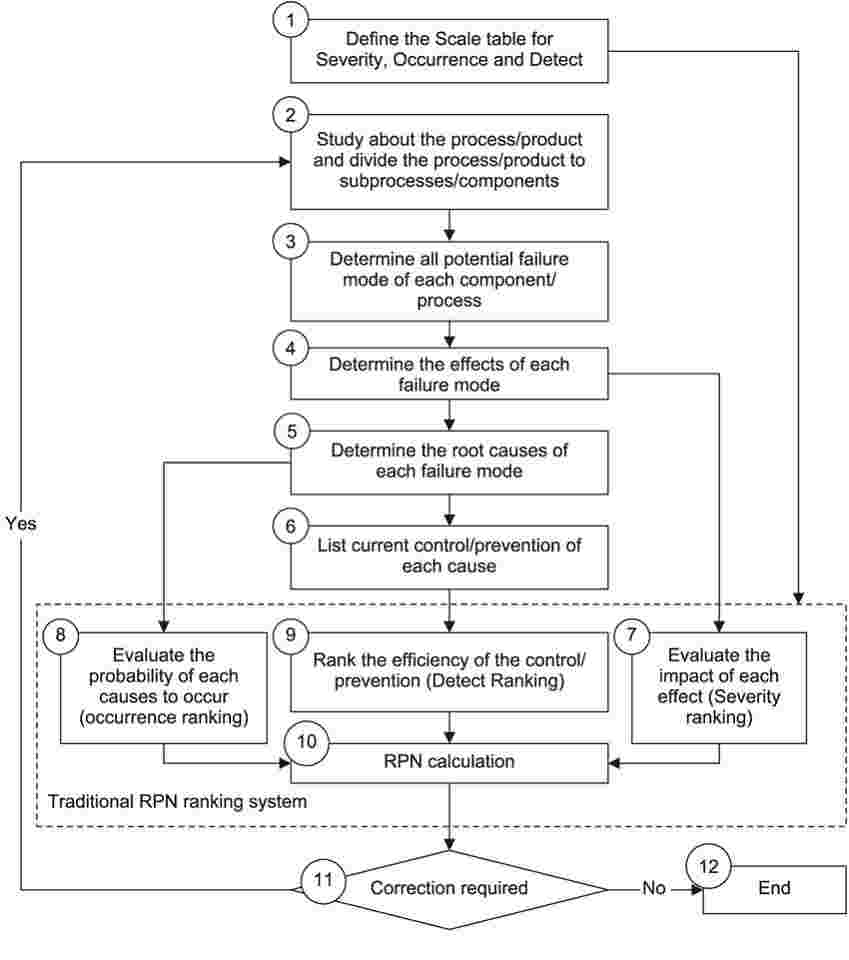
One of the primary components for the development of a successful FMEA includes the assignment of Risk Priority Numbers (RPN). There are several ways to do this, and the traditional method is one. The traditional method includes assigning an arbitrary number to each activity step within a given system.
Source:https://www.researchgate.net/
Usually, only factoring in the severity of a potential failure mode. However, this method of addressing problems from the largest RPN to the smallest is not as reliable. It ignores three critical factors.
The factors being: the weights of severity (SEV), occurrence (OCC), and detection (DET). These metrics drive the RPN number and should be considered for any robust design or process related FMEA. This is a metric that is calculated as:
Severity x occurrence x detection = RPN
For the metric of Severity, ask your Kaizen team what the cost to the customer is due to this defect? One of the principals of lean six sigma methodology is to always attempt to bring your efforts back to the customer. It can be due to not meeting the production rate or time demanded by the customer.
May include safety regulations, legal risk, or damage to company reputation. Does this failure stop a production line altogether? If yes, then it may be considered a 10 on your severity metric, but perhaps only if the part is a single point of failure. Examine if this failure affects the entire production or only part of the production.
Consider, there is a critical item that is a single point of failure to a production line. But, there are 5 production lines, then it can hardly be considered a single point of failure. Instead, consider that the failure would ‘only’ effectively shut down a fifth of your total throughput.
But it still may be regarded as critical compared to other effects. In this case, the severity measure is somewhat ambiguous. Therefore, consulting is recommended with a cross-functional team in your organization where members agree on a measure of severity from 1 to 10. A low number would suggest a low impact, with a high number suggesting a high impact.
Further inclusion of FMEA design includes development and analysis of Occurrence through a ranking of potential causes and prevention controls. This analysis is primarily conducted by gathering past failures and the mechanism for which those inputs may fail. If it is a new process, then the analysis of current prevention control is conducted.
The team must gather past data and ask itself what the method for which this input is controlled is? How often has failure occurred in the past week, month, or year? Is work controlled through standard practice? Is an audit of standard work detailed and timely or is work controlled through methods such as Kanban and Andon triggers that may decrease the occurrence of failure? How often is preventative maintenance performed (if applicable)?
In this stage, it is critical to have active and engaged members of the cross-functional team. That is because this group should have a solid knowledge of how often the cause occurs.
Based on this analysis, assess the likelihood of failure through an Occurrence Table. That will detail the possibility from Very High to Very Low in occurrence. This assessment is typically measured in the frequency of failure/incidents per thousand runs/items produced.
The table below is a common example of ranking frequency from 1 to 10, with ≥ 100 per thousand on the high end and less than .001 per thousand on the lowest end with virtually no failure possible (rarely seen in six sigma initiatives).
-1.jpg)
Source: https://accendoreliability.com/understanding-fmea-occurrence-risk-part-1/
The final metric in the calculation of the Risk Priority Number (RPN) involves identifying the method in which the team can detect or prevent the cause of failure. In the same way, in which the severity and occurrence metric was measured utilizing a scale from 1-10, the Detection metric is calculated similarly. A high score of 10 would indicate no ability to detect or prevent a failure from occurring. A 1 would mean a near-perfect method to prevent and detect a failure from occurring.
When evaluating causes, consider what methods of control exist, especially when there is a human element within the system. Does the cause heavily rely on personal training? Humans are prone to error without the assistance of error-proofing methods or commonly referred to in lean teachings as ‘poka-yoke.’ The detection metric is typically measured as a degree of detection by percentage, such as the example below:
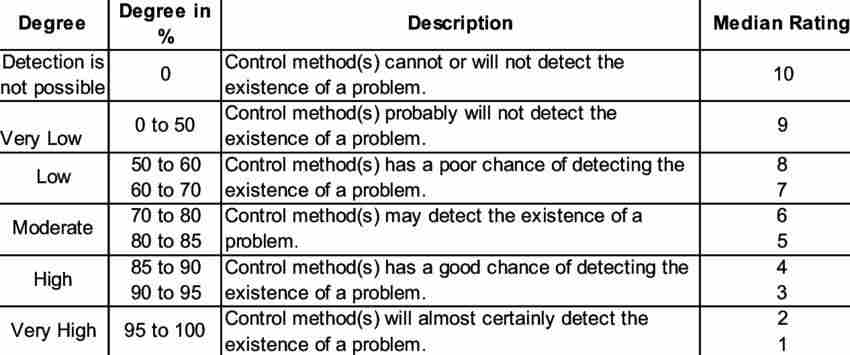
FMEA Degree of Risk Detection Ranking
Source: https://www.researchgate.net
Now that Severity, Occurrence, and Detection have all been tabulated, the team can see the fruits of their labor by calculating and reviewing RPN scores. Once again, the calculation of RPN is simply SEVERITY x OCCURANCE x DETECTION scores.
The lowest possible scores will be closer to 1, with the highest possible score being 1,000. The team can now visualize by activity step and cause, where the greatest risk is to the business and remediate through corrective and preventative action measures (CAPA).
As a final note, be strategic during this time after the FMEA is performed, as high numbers in certain areas may heavily weight some RPN scores. Further, assess how easy it may be to implement a change. For example, seeking financial funding for additional methods of detection may be more complicated than implementing new preventative maintenance measures for the various causes to decrease the occurrence or vice versa. In this regard, the FMEA is just the beginning of a journey of continuous improvement. It serves as a key tool in the toolbelt to give the organization a quantifiable justification for targeted action in just the right areas.
Explore more tools for process excellence. Join the certification bootcamp